
Figures & data
Table 1 Sociodemographic characteristics among OPD clients in four selected health facilities in Harar, Ethiopia, 2011
Table 2 Knowledge, risk perceptions, awareness, and source of information among OPD clients toward HIV/AIDS and PITC in Harar, Ethiopia, 2011
Figure 1 Percentage distribution of participants tested or not tested for HIV in Harar, Ethiopia, 2011.
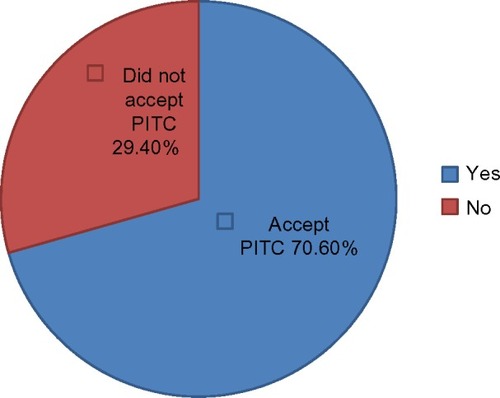
Figure 2 Percentage distribution of when participants think that one should be tested for HIV in Harar, Ethiopia, 2011.
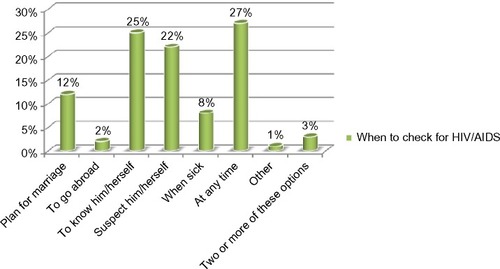
Table 3 Sociodemographic factors affecting the acceptance of PITC among OPD clients in Harar, Ethiopia, 2011
Table 4 Knowledge, risk perceptions, awareness, and acceptability among OPD clients toward HIV/AIDS and PITC, as related to factors affecting the acceptance of PITC among clients in Harar, Ethiopia, 2011