
Figures & data
Figure 1 Scheme of the brain tissue analysis from AIDS patients with and without apparent features of HIVE-induced dementia using the Affymetrix microarray platform.
Abbreviations: HIVE, HIV-associated encephalitis; DEGs, differentially expressed genes; PPI, protein-protein interaction.
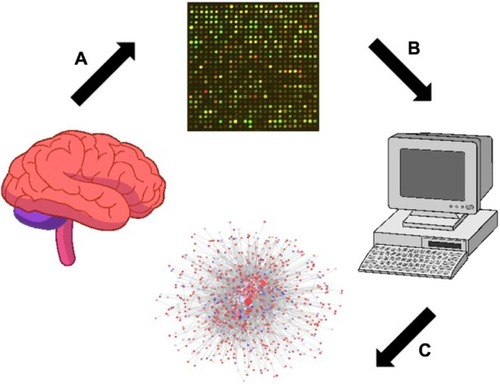
Figure 2 MA-plots of Affymetrix microarrays (n=4) plotted with common pseudo-array reference and represented each gene with a dot for AIDS patients with (A and B) and without (C and D) HIVE-induced dementia.
Abbreviations: AIDS, acquired immunodeficiency virus syndrome; HIV, human immunodeficiency virus; HIVE, HIV-associated encephalitis; IQR, interquartile range.
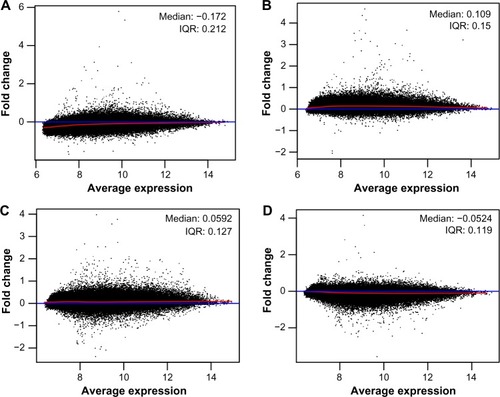
Figure 3 Box-plots of raw (A) and RMA-normalized (B) data from four replicate Affymetrix arrays.
Abbreviation: RMA, robust multiarray average.
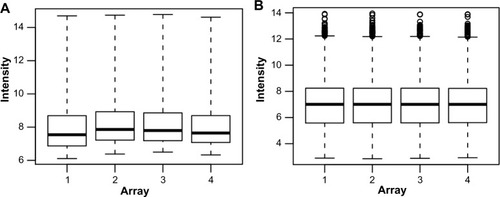
Figure 4 “Induced” graphs of the enriched GO categories for GO:0005886 (A), GO:0044459GO (B), and GO:0000166 (C) terms with highest counts of DEGs in samples from AIDS patients with and without HIVE-induced dementia.
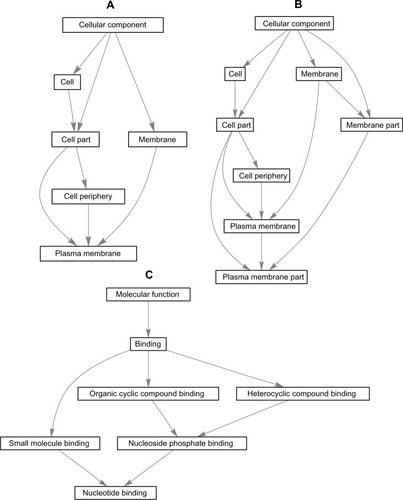
Table 1 Top ten significantly enriched GO terms with high counts of DEGs in samples from AIDS patients with and without HIVE-induced dementia
Table 2 Top ten enriched KEGG pathways of DEGs with low P-values in samples of AIDS patients with and without HIVE-induced dementia
Figure 5 PPI network constructed from the list of DEGs on the basis of human interactome using spring embedded layout.
Abbreviations: PPI, protein–protein interaction; DEGs, differentially expressed genes; FC, fold change; min, minimum; max, maximum.
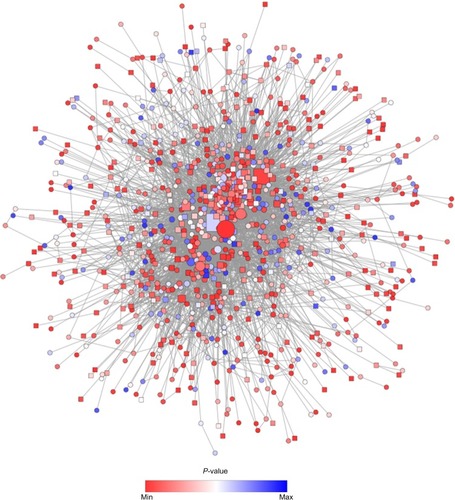
Figure 6 Subnetworks identified from the local PPI network using unweighted force-directed layout.
Abbreviations: PPI, protein–protein interaction; DEGs, differentially expressed genes; FC, fold change.
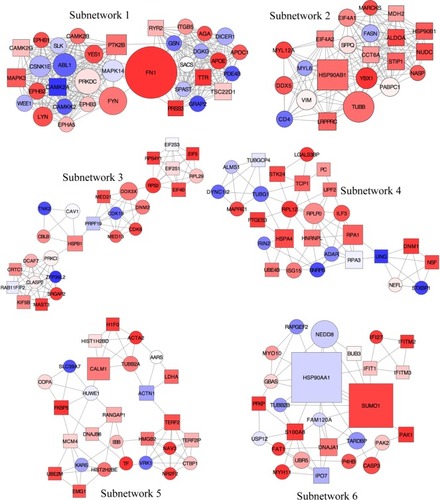
Table 3 Statistics for top six subnetworks identified by MCODE method in PPI network for AIDS patients with and without HIVE-induced dementia
Table 4 Top 15 hub nodes identified in PPI network for DEGs from samples of AIDS patients with and without HIVE-induced dementia
Figure 7 Total percentage of hubs identified for six subnetworks to detect main DEGs associated with different cellular processes.
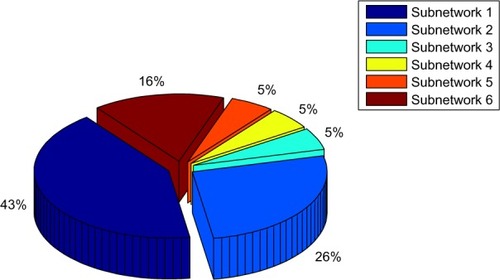
Table S1 R script to define and analyze differentially expressed genes (DEGs) from four Affymetrix microarrays