
Figures & data
Table 1 Population characteristics
Table 2 Bone metabolism and mineralization indexes of enrolled patients
Figure 1 Correlations between QUI/stiffness index and lumbar BMD (A), femoral BMD (B), FRAX score (C), and BMI (D).
Abbreviations: BMD, bone mineral density; BMI, body mass index; FRAX, Fracture Risk Assessment Tool; QUI, quantitative ultrasound index.
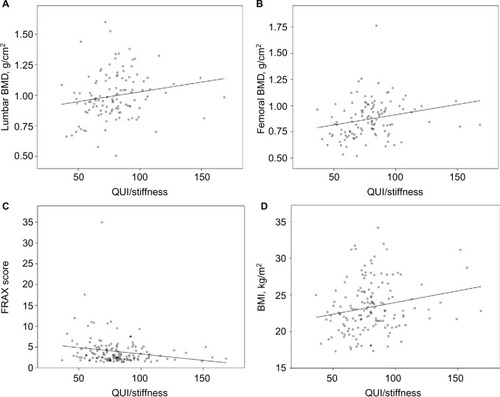
Table 3 Multivariate analysis of determinants of low calcaneal QUI/stiffness (<10° percentile)