
Figures & data
Table 1 Profile of all patients
Table 2 Univariate logistic regression in the training set
Figure 1 ROC curve of UICindex.
Abbreviations: ROC, receiver operating characteristic; UIC, Universal Index for Cirrhosis.
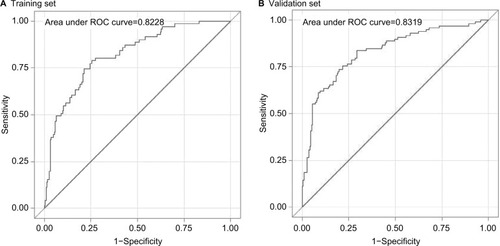
Table 3 Comparing the UICindex of cirrhosis with other existing indices
Table 4 Accuracy of the UICindex in predicting cirrhosis