
Figures & data
Table 1 Baseline (pre-treatment) patients’ characteristics (n=167)
Table 2 Types, duration, and combinations of treatment regimes
Table 3 Baseline characteristics of 11 patients with failure to achieve SVR12
Table 4 Comparison between patients according to response to therapy
Figure 1 Sustained virologic response (SVR) rate based on different baseline patient demographic data and comorbidities.
Abbreviations: DM; diabetes mellitus. ESRD; end-stage renal disease. HTN; hypertension. RTx; renal transplant. SCD; sickle-cell disease. P-values are >0.05 in all by Chi-Square.
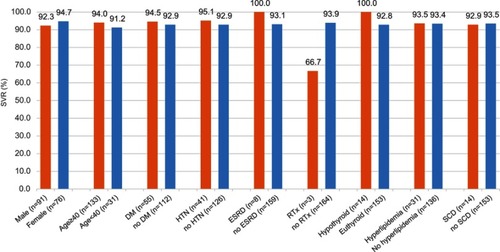
Figure 2 Sustained virologic response (SVR) rate based on viral, hepatic, and regimen parameters. SOF; sofosbuvir.
Abbreviations: OPR; Ombitasvir/Paritaprevir/Ritonavir. LTx; liver transplantation. 400 K; 400,000 IU/L. GT; genotype. RIBA; ribavirin. P-value by Chi-Square test.
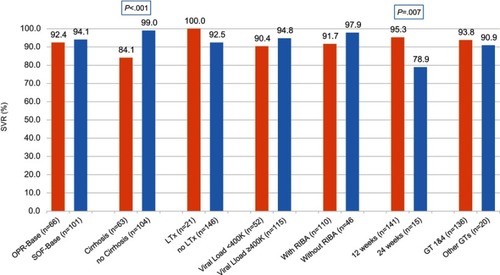
Table 5 Results of the multivariate logistic regression analysis for the independent predictors of sustained virologic response
Figure 3 Percentage Sustained virologic response (SVR) and non-sustained virologic response (No SVR) in patients who received the SOF-based (n=101) and OPR-Bree (n=66) regimens. P=0.754 by Fisher’s exact test. SOF= sofosbuvir.
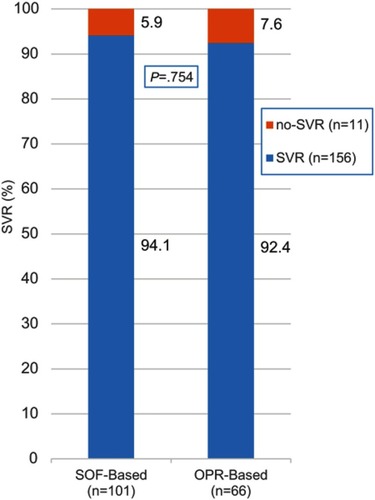
Table 6 The impact of treatment on the laboratory results