Figures & data
Table 1 Demographics of study population
Figure 1 CCA patients vs healthy controls. PCA scores plots for (A) positive and (B) negative ion mode data of CCA patients and healthy controls. OPLS-DA scores plots showing group separation for both (C) positive and (D) negative ion mode data and the corresponding permutation tests for (E) positive and (F) negative ion mode data.Abbreviations: CCA, cholangiocarcinoma; PCA, principal component analysis; OPLS-DA, orthogonal projections to latent structures discriminant analysis.
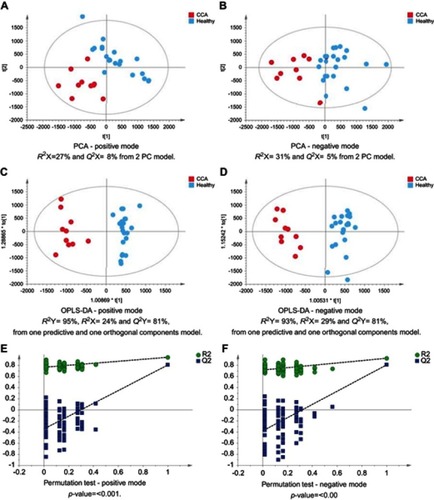
Figure 2 CCA patients vs patients with SOD. PCA scores plots for (A) positive and (B) negative ion mode data of CCA patients and SOD cases. OPLS-DA scores plots showing group separation for both (C) positive and (D) negative ion mode data and the corresponding permutation tests for (E) positive and (F) negative ion mode data.
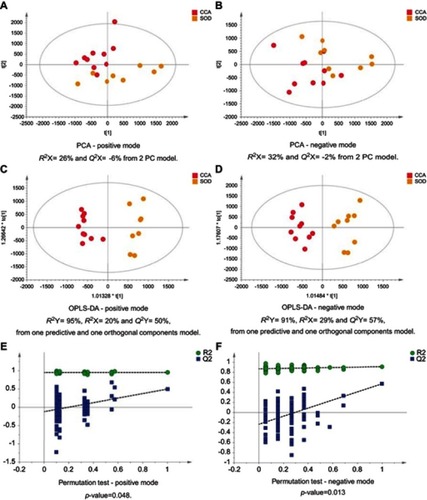
Figure 3 CCA patients vs patients with gallstones. PCA scores plots for (A) positive and (B) negative ion mode data of CCA patients and gallstones cases. OPLS-DA scores plots showing group separation for both (C) positive and (D) negative ion mode data and the corresponding permutation tests for (E) positive and (F) negative ion mode data.
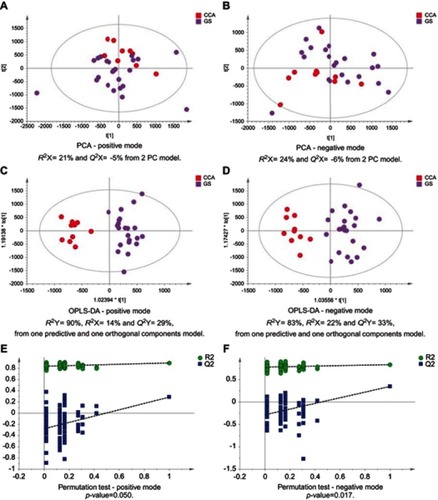
Figure 4 CCA patients vs biliary strictures patients. PCA scores plots for (A) positive and (B) negative ion mode data of CCA patients and biliary strictures patients. OPLS-DA scores plots showing group separation for both (C) positive and (D) negative ion mode data and the corresponding permutation tests for (E) positive and (F) negative ion mode data.
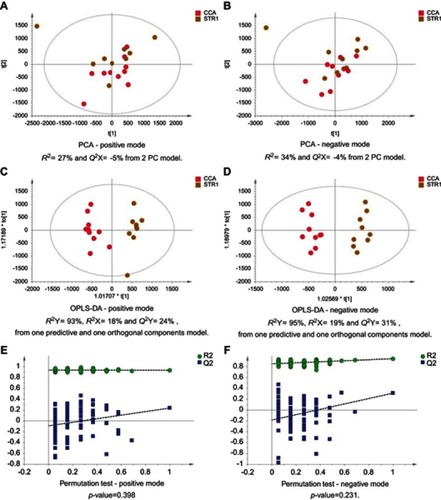
Figure 5 CCA vs noncirrhotic HCV patients. PCA scores plots for (A) positive and (B) negative ion mode data of CCA patients and HCV patients. OPLS-DA scores plots showing group separation for both (C) positive and (D) negative ion mode data and the corresponding permutation tests for (E) positive and (F) negative ion mode data.
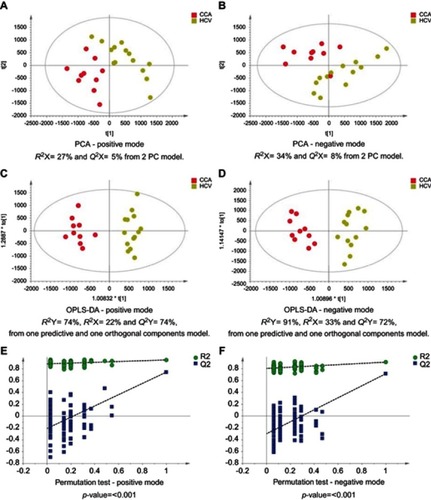
Figure 6 Box and whisker plots of compounds different between cholangiocarcinoma (CCA) cases and benign controls–carnitine species. *p 0.05, **p 0.01 and ***p 0.001. Y-axis= relative intensity.
Abbreviations: CCA, cholangiocarcinoma; GS, gallstones; SOD, sphincter of Oddi dysfunction; STRI, strictures; HCV, noncirrhotic hepatitis C.
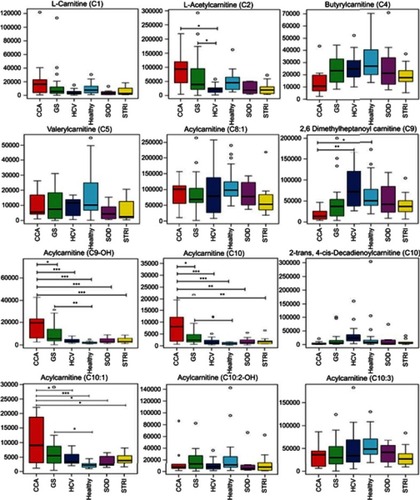
Figure 7 Box and whisker of compounds different between cholangiocarcinoma (CCA) cases and benign controls: ESI+ metabolites. *p 0.05, **p 0.01 and ***p 0.001. Y-axis= relative intensity.
Abbreviations: CCA, cholangiocarcinoma; GS, gallstones; SOD, sphincter of Oddi dysfunction; STRI, strictures; HCV, noncirrhotic hepatitis C.
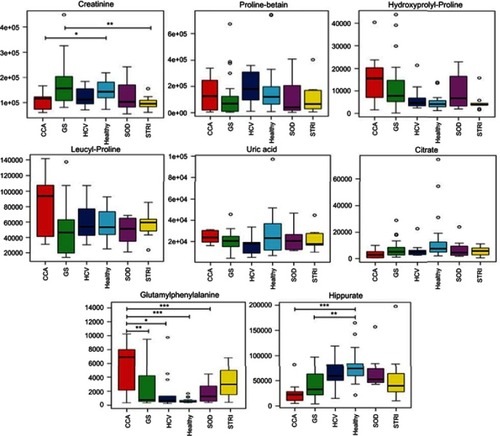
Figure 8 Box and whisker plots of compounds different between cholangiocarcinoma (CCA) cases and benign controls: ESI− metabolites. *p 0.05, **p 0.01 and ***p 0.001. Y-axis= relative intensity.
Abbreviations: CCA, cholangiocarcinoma; GS, gallstones; SOD, sphincter of Oddi dysfunction; STRI, strictures; HCV, noncirrhotic hepatitis C.
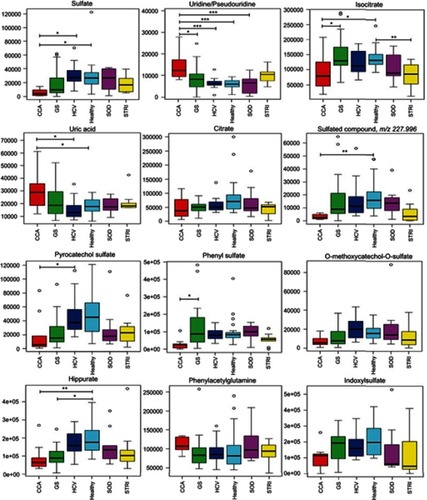
Figure 9 Box and whisker plots of compounds different between cholangiocarcinoma (CCA) cases and benign controls: ESI− metabolites. *p 0.05, **p 0.01 and ***p 0.001. Y-axis= relative intensity.
Abbreviations: CCA, cholangiocarcinoma; GS, gallstones; SOD, sphincter of Oddi dysfunction; STRI, strictures; HCV, noncirrhotic hepatitis C.
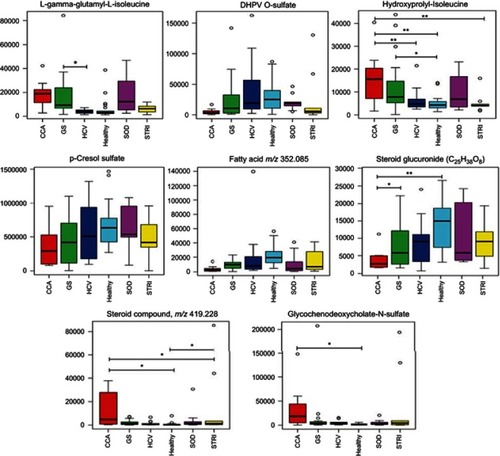
Table 2 Altered metabolites between cholangiocarcinoma patients compared to healthy controls – positive mode
Table 3 Altered metabolites between cholangiocarcinoma patients compared to healthy controls – negative mode
Figure 10 Urine metabolites associated with the metabolic signatures of the six distinct disease conditions – positive mode. (A) Scores plot of the principal component analysis (PCA) analysis, R2Y=41% and Q2Y=16% from 2 PC model, p-value=0.01 from permutation test and (B) important metabolites selected on the basis of VIP score.
Abbreviations: CCA, cholangiocarcinoma; GS, gallstones, HCV, noncirrhotic hepatitis C; SOD, sphincter of Oddi dysfunction; STRI, strictures.
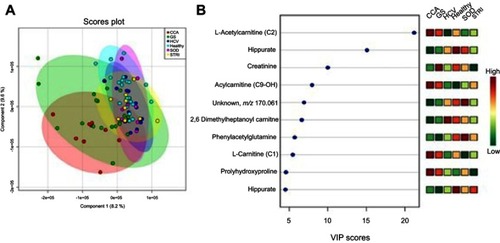
Figure 11 CCA patients vs HCC patients. PCA scores plots for (A) positive and (B) negative ion mode data of CCA patients and HCC patients. OPLS-DA scores plots showing group separation for both (C) positive and (D) negative ion mode data and the corresponding permutation tests for (E) positive and (F) negative ion mode data. Abbreviations: CCA, cholangiocarcinoma; HCC, hepatocellular carcinoma; PCA, principal component analysis; OPLA-DA, orthogonal projections to latent structures discriminant analysis.
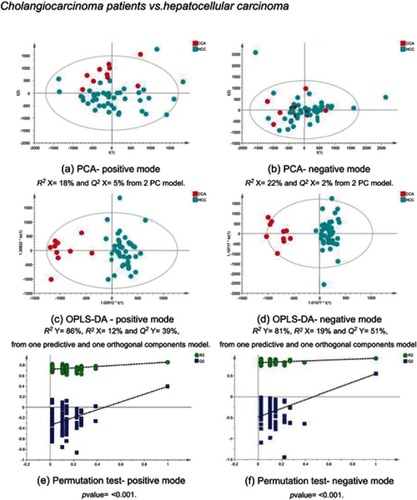
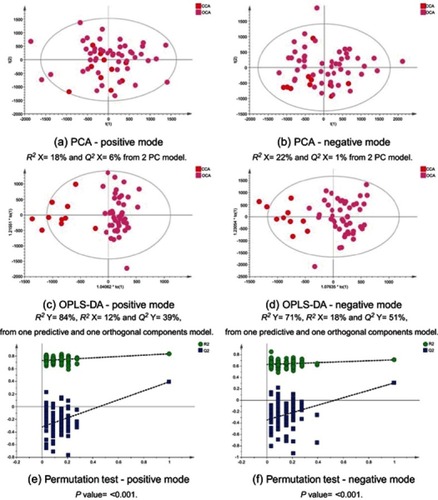
Figure 12 CCA patients vs ovarian cancer. PCA scores plots for (A) positive and (B) negative ion mode data of CCA patients and OCA patients. OPLS-DA scores plots showing group separation for both (C) positive and (D) negative ion mode data and the corresponding permutation tests for (E) positive and (F) negative ion mode data. Abbreviations: PCA, principal component analysis; CCA, cholangiocarcinoma; OCA, ovarian cancer; OPLS-DA, orthogonal projections to latent structures discriminant analysis.