
Figures & data
Figure 1 Mean levels of ALT and AST between CHB and healthy groups.
Abbreviations: CHB, chronic hepatitis B; AST, aspartate aminotransferase; ALT, alanine aminotransferase.
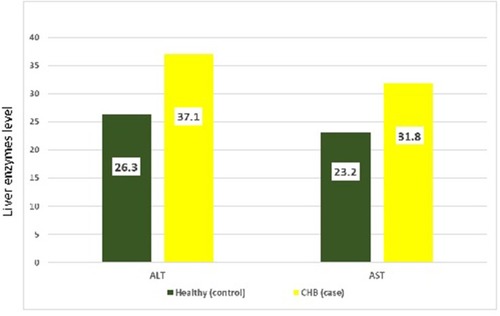
Table 1 Frequency Distribution For CHB And Healthy Groups
Table 3 Results Of Multiple Logistic Regression For NAFLD
Table 2 Frequency Distribution Of Status Of Liver In CHB And Healthy Groups