Figures & data
Table 1 Animal Grouping
Table 2 Preliminary Phytochemical Screening Results of HMSELS
Figure 1 Effect of HMSELS on the body weight change at different days (expressed in terms of mean ±SEM).
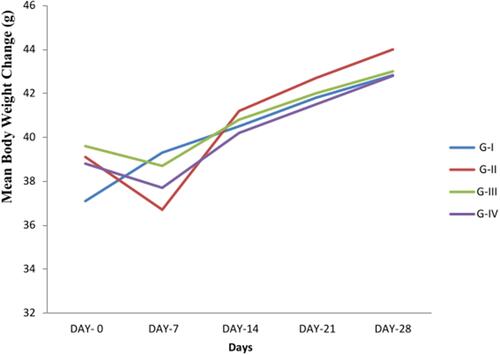
Table 3 Comparison of Mean ±SEM Value of Body Weight and Liver Weight Among the Four Groups
Table 4 Comparison of the Mean ±SEM Value of Liver Enzymes Among the Four Groups of Male Swiss Albino Mice
Table 5 Comparison of the Mean ±SEM Value of Albumin and Total Bilirubin Among the Four Groups of Male Swiss Albino Mice
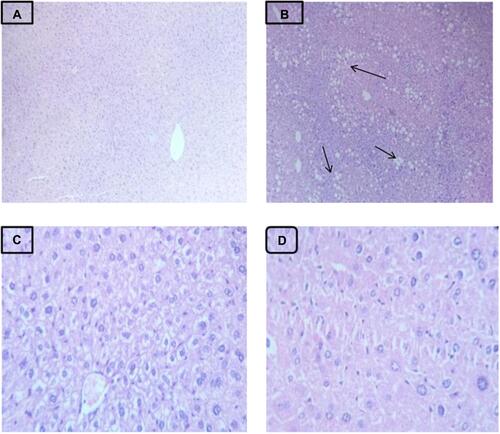
Figure 2 Photomicrographs of H&E stained liver sections of mice. (A) Group I. (B) Group II – liver sections present severe degenerative changes in hepatocytes including fatty changes (arrows). (C) Group III. (D) Group IV.