
Figures & data
Table 1 The Correlational Analysis Shows Implications of Age, BMI, Blood Lipids, and Area of Liver Steatosis on Fasting Insulin or HOMA-IR
Figure 1 The comparison of clinical characteristics of patients with simple steatosis (SS) versus normal health control (HC) in GSE89632; the result of blood lipid assessments showed no significance between SS and HC.
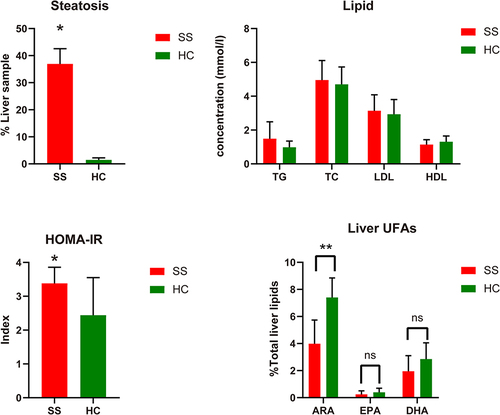
Figure 2 The Pearson correlation of clinical characteristics of NAFLD and regular liver donors. (A) Moreover, (B) shows multiple linear regression as fasting insulin is a dependent variable. (C) Furthermore, (D) shows Pearson correlation analysis of fasting insulin and HOMA-IR with multiple clinical characteristics.
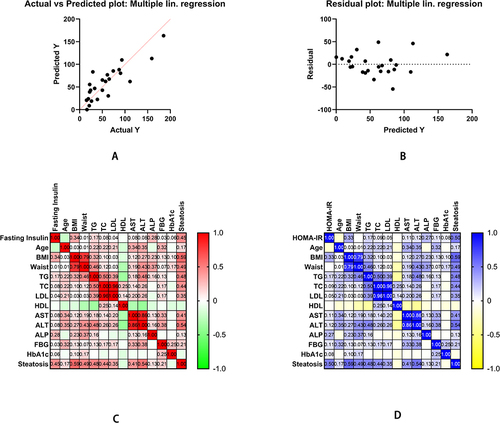
Figure 3 Continued.
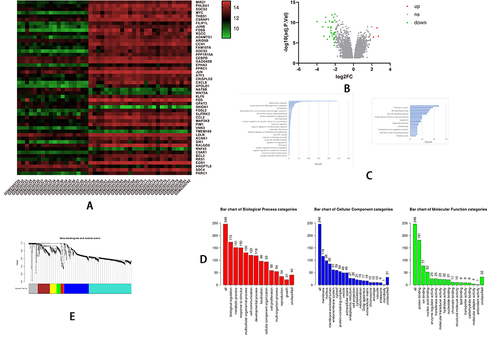
Figure 3 The bioinformatics analyses of global genetic features of NAFLD using data of GSE89632. (A) The heatmap shows the expressions of the top 50 significant genes in liver samples of SS versus HC; The deep red color represents the extent of high expressions of DEGs, whereas the green color represents the lower expressions of DEGs. The sample number from GSM238570 to GSM2385755 on the left bottom of heatmap and GSM 2385773, GSM 2385777 indicate SS group, whereas the sample numbers on the right bottom from GSM2385757 to GSM2385782 except GSM 2385773, GSM 2385777 indicate HC group. The right side lists the official gene symbols of the top 50 significant genes. (B) The volcano plot of expressions of DEGs; the define and cut-off of up- (red) or down- (green) regulated genes are the absolute values of log2Fold change which exceed 2, and the label of Y-axis is the -log10 adjusted P-value. (C) The overview of GO analysis of the DEGs, the order was defined by collected counts of DEGs in multiple Gene ontology (biological process, molecular function, and cellular component). P < 0.05. (C) The overview of KEGG pathway analysis of the DEGs, the order was defined by collected counts of DEGs in multiple KEGG pathways. P < 0.05. (D) The overview of respective GO component analysis of the DEGs, the order was defined by collected counts of DEGs in multiple Gene ontology (biological process, molecular function, and cellular component). P < 0.05. (E) WGCNA analyses show the dendrogram of genes divided into 7 modules with different colors. The height shows the heterogeneities of different co-expressed genes groups. (F) WGCNA analyses show the heatmap on the expression of 7 different modules, the different modules in different colors indicate corresponding co-expressed gene groups, the gene amounts have been indicated on the correct upper box. The bottom displays a liver sample. SS: simple Steatosis, HC: normal health control. (G) WGCNA analyses show the network connections in each meaningful module. A different color indicated each module. (H) GSEA analyzed the heatmap of top 50 genes; The upper label showed numbers of liver samples, and the correct label indicates the official gene symbols of the top 50 significantly expressed genes. Red color indicates up-regulated, and blue indicates down-regulated. The samples ID with SS indicate SS group, whereas sample ID with HC indicates HC group. (I) An overview of up-regulated genes by GSEA analysis. In each figure, the up-regulated genes sets were displayed with a positive enrichment score. The last figure of the butterfly plot showed a signal-to-noise score in this GSEA analysis.
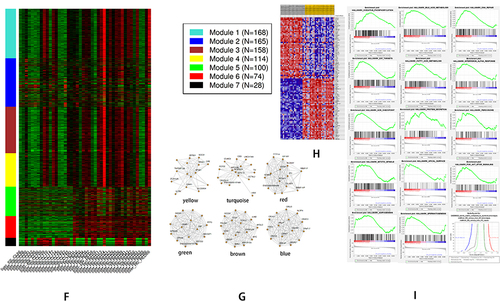
Figure 4 Continued.
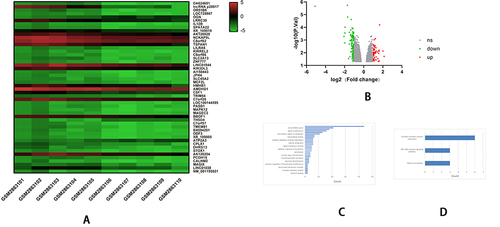
Figure 4 The bioinformatics analyses of the features of LncRNA in NAFLD using data of GSE107231. (A) The heatmap shows the expressions of top 50 significant genes including DEGs in liver samples of NAFLD versus normal; The deep red color represents the extent of high expressions of DEGs, whereas the green color represents the lower expressions of DEGs. The sample numbers from GSM2863101 to GSM2863105 on the left bottom of the heatmap indicate the normal control group, whereas the sample numbers on the right bottom from GSM2863106 to GSM2863110 indicate the NAFLD group; The right side lists the official gene symbols of significant genes. (B) The volcano plot of expressions of DEGs; the define and cut-off of up- (red) or down- (green) regulated genes are the absolute values of log2Fold change which exceed 1, and the label of the Y-axis is the -log10 adjusted P-value. (C) The overview of GO analysis of the DEGs, the order was defined by collected counts of DEGs in multiple Gene ontology (biological process, molecular function, and cellular component). P < 0.05. (D) The overview of KEGG pathway analysis of the DEGs, the order was defined by collected counts of DEGs in multiple KEGG pathways. P < 0.05. (E) The dendrogram of genes are divided into 7 modules with different colors. The height shows the heterogeneities of different co-expressed genes groups. (F) The heatmap on the expression of 10 different modules, the different modules in different colors indicate corresponding co-expressed gene groups, the gene amounts have been indicated on the upper right box. The sample numbers from GSM2863101 to GSM2863105 on the left bottom of the heatmap indicate a normal group, whereas sample numbers on the right bottom from GSM2863106 to GSM2863110 indicate the NAFLD group. (G) The network connections in each meaningful module. A different color indicated each module. (H) GSEA analyzed the heatmap of top 50 genes; The upper label showed numbers of liver samples, and the right label indicates the official gene symbols of the top 50 significantly expressed genes. Red color indicates up-regulated, and blue indicates down-regulated. The sample numbers from GSM2863101 to GSM2863105 marketed by yellow indicate a normal control group, whereas sample numbers from GSM2863106 to GSM2863110 indicate the NAFLD group. (I) An overview of up-regulated genes by GSEA analysis. In each figure, the up-regulated genes sets were displayed with a positive enrichment score. The last figure of the butterfly plot showed a signal-to-noise score in this GSEA analysis.
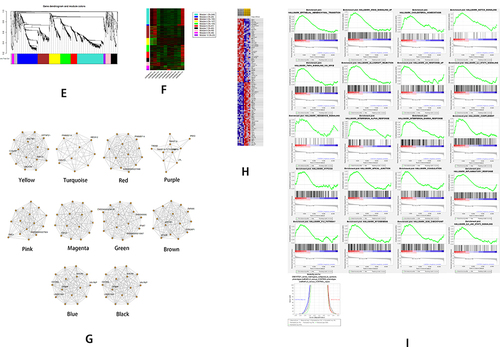
Figure 5 The bioinformatics analyses of the features of MiRNA in NAFLD using data of GSE114923. (A) The heatmap shows the expressions of top 455 DEGs (partially displayed) in serum samples of NAFLD versus normal; The deep red color represents the extent of high expressions of DEGs, whereas the green color represents the lower expressions of DEGs. The sample numbers from GSM3154851 to GSM3154854 on the left bottom of the heatmap indicate the NAFLD group, whereas the sample numbers on the right bottom from GSM3154855 to GSM3154850 indicate normal control group; The right side lists the official gene symbols of top 455 DEGs (partially displayed). (B) The MA plot (left) and a volcano plot (right) of expressions of DEGs; the define and cut-off of up- (red) or down- (blue) regulated genes are the absolute values of log2Fold change which exceed 2.
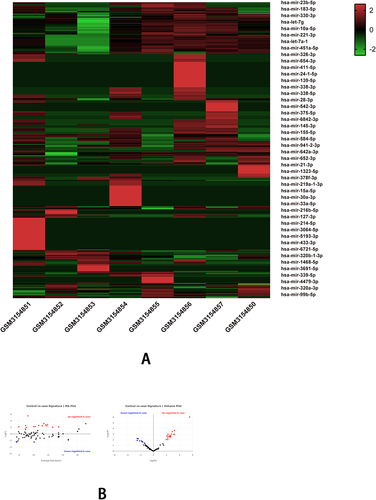
Table 2 Analysis of General Characteristics and Biochemical Test Data of NAFLD and Control Group
Figure 6 Comparisons of general characteristics and biochemical test data between NAFLD and control group on Age (A), BMI (B), waist (C), WHR (D), SBP, DBP (E), FPG (F), blood lipids (G), and aminotransferase (H); The results showed that besides Age, SBP, there were significant disparities in BMI, waist, WHR, DBP, FPG, blood lipids, and aminotransferase between the NAFLD and normal participants.
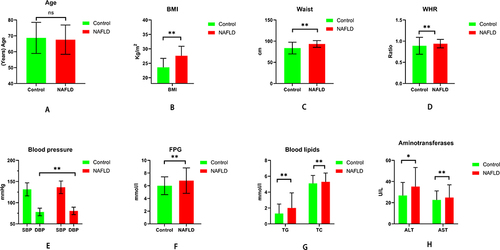
Table 3 Chi-Square Analysis of Constitutional Characteristics of NAFLD and Control Group
Figure 7 The comparisons of TCM constitution distributions between NAFLD and control groups.
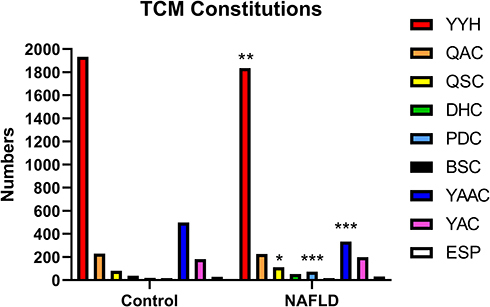
Table 4 Binary Logistic Regression Analyzes the Implications of Metabolic Characteristics and TCM Constitutions on NAFLD
Table 5 Multiple Linear Regression Analysis Shows Significant Factors with Fasting Plasma Glucose (FPG) (P < 0.05)
Table 6 Binary Logistic Regression Analysis on the Implications of Metabolic Characteristics and TCM Constitutions on DM
Data Sharing Statement
The data and material are conserved by Dr. Chengying Gu and can be accessed via contact the Email of Dr. Chengying Gu.