Figures & data
Table 1 The Clinical Characteristics of HCC Patients in the TCGA Dataset
Figure 1 Flow chart of this study.
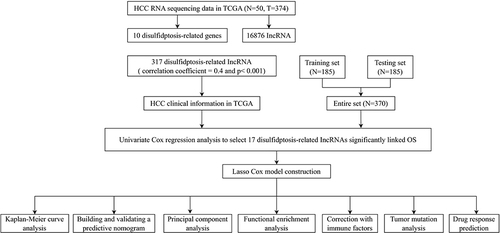
Figure 2 Creation of a lncRNA predictive signature associated with disulfidptosis. (A)Sankey diagram displaying the co-expression of genes and lncRNAs associated with disulfidptosis. (B) LASSO coefficient profiles of the disulfidptosis-related abnormally expressed lncRNAs in HCC samples. (C) Selection of the ideal parameter (λ) in the LASSO model. (D) Heatmap showing the co-expression of disulfide death-related genes and bisulfide death survival-related lncRNAs (*p < 0.05, **p<0.01,***p<0.001).(E) Forest plots representing the results of the univariate Cox regression analysis of the abnormally expressed lncRNAs linked to disulfidptosis.
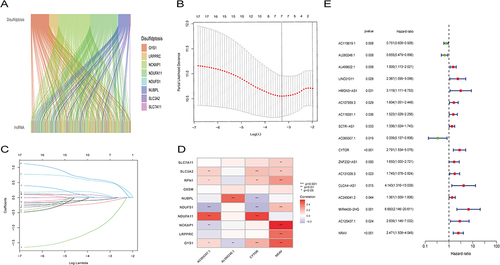
Figure 3 The predictive value of HCC is being evaluated and validated in testing, training, and all sets. (A–C) Increasing risk scores are shown in the patient distribution. (D–F) Patient survival rates and risk levels. (G–I) The heat map shows the expression of four important lncRNAs with rising risk scores. (J–L) OS of HCC patients were compared between high- and low-risk sets using the Kaplan-Meier method.
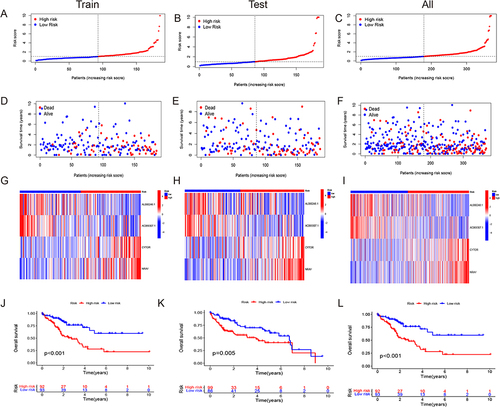
Figure 4 Evaluation of the disulfidptosis-related lncRNAs’ predictive risk model and the clinical characteristics of HCC in the full TCGA dataset. (A) This prognostic model’s sensitivity and specificity are evaluated using a time-dependent ROC analysis. (B) Risk score and clinical characteristics ROC curves. (C) C-index for risk assessment and clinical features (D) The progression-free survival for the entire HCC patient population. (E and F) The Kaplan–Meier contours for low- and high-risk HCC patients in stages I–II (E) and stages III–IV (F).
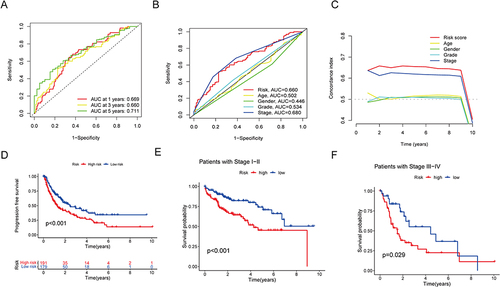
Figure 5 Nomogram and independent prognostic analysis. (A) Forest plot of independent univariate prognostic analysis. (B) Forest plot of multivariate independent prognostic analysis. (C) Nomogram for estimating the OS of HCC patients at different time points. (D) Calibration curves for the nomogram predictions (*p < 0.05).
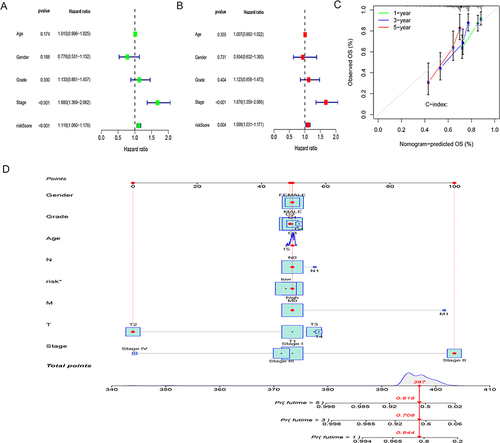
Figure 6 Using principal component analysis, compare the risk groupings at high and low levels depending on. (A–D) all gene expression profiles (A), 10 disulfidptosis-related genes (B), 317 disulfidptosis-related lncRNAs (C), and risk model based on the representation profiles of the 317 disulfidptosis-related lncRNAs (D) in the TCGA entire set.
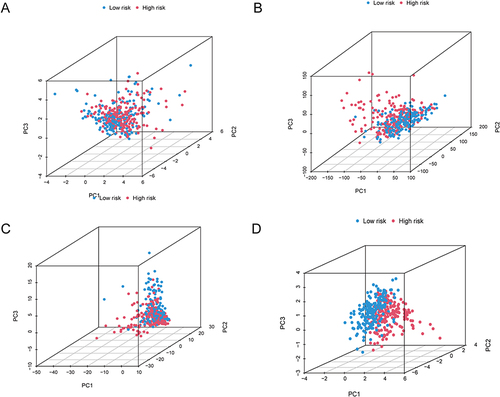
Figure 7 Functional enrichment analysis of DEGs associated with disulfidptosis. (A–D) The TCGA cohort’s most significant GO enrichment (A and B) and KEGG pathways (C and D). (E and F) Based on the entire TCGA high-risk (E) and low-risk (F) groups, GSEA revealed the top five pathways with the most significant enrichment.
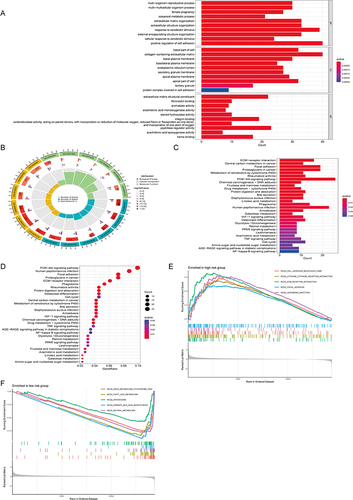
Figure 8 Estimation of the tumor immune microenvironment and cancer immunotherapy response utilizing the disulfidptosis-related lncRNA model in the TCGA complete data set. (A) TME score in the patients at high- and low-risk (*p < 0.05). (B and C) Boxplots are used to depict the relative percent and percentage of 22 immune cells (*p < 0.05, ***p<0.001). (D) Boxplots show the results of 29 immune-related activities (*p < 0.05, **p<0.01, ***p<0.001).
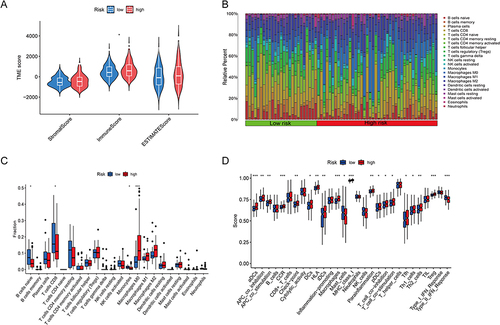
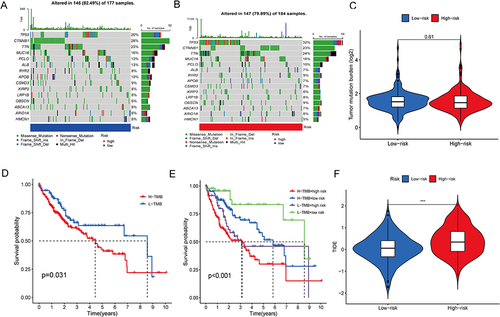
Figure 9 Tumor mutation analysis. (A and B) The distribution of the top 15 commonly mutated genes in patients with HCC in the high-risk (A) and low-risk (B) groups. (C) The burden of tumor mutation in the high-risk and low-risk groups. (D) OS of the high- and low-TMB groups. (E) OS of the high-TMB + high-risk group, high-TMB + low-risk group, low-TMB + high-risk group, and low-TMB + low-risk group. (F) The difference in TIDE score between the high- and low-risk groups. TIDE, tumor immune dysfunction and exclusion (***p<0.001).