Figures & data
Figure 1 Time temperature protocol. SK-N-SH cells were exposed to either 0.2% or 8% O2 for 24 hours followed by normothermia (37°C) or hypothermia (33.5°C) for 24, 48 or 72 hours (total 48, 72 and 96 hours).
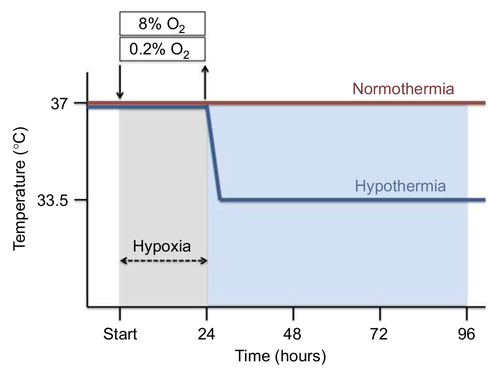
Figure 2 LDH release in SK-N-SH cells exposed to (A) 0.2% or (B) 8% O2 for 24 hours followed by normothermia/hypothermia for 24, 48, or 72 hours (total 48, 72 and 96 hours, n=3–4, *p<0.05).
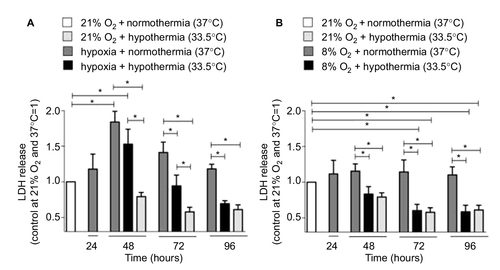
Figure 3 (A) NSE release in SK-N-SH cells exposed to hypoxia (0.2% O2 for 24 hours) followed by normothermia/hypothermia for 72 hours compared to SK-N-SH at atmospheric normoxia and hypothermia/normothermia for 72 hours (n=3, *p<0.05). (B) Intracellular ATP concentration in SK-N-SH cells exposed to hypoxia (0.2% O2 for 24 hours) followed by normothermia/hypothermia compared to SK-N-SH at atmospheric normoxia and hypothermia/normothermia (n=4, *p<0.05).
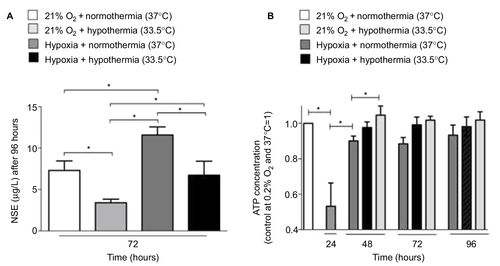
Figure 4 Cell morphology after 24 hours of atmospheric normoxia, subatmospheric oxygen tension, or hypoxia (21%, 8%, or 0.2% O2) followed by 72 hours of normothermia (37°C) or hypothermia (33.5°C). SK-N-SH cells are stained with anti-beta III-Tubulin (red) and DAPI (blue).
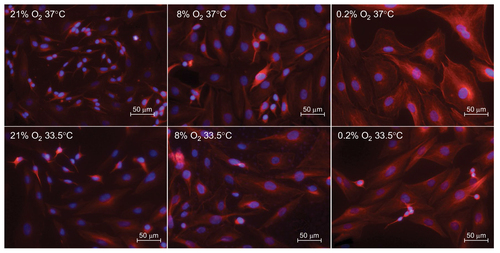
Figure 5 Expression of RBM3 mRNA in SK-N-SH after (A) 48 hours of moderate hypothermia compared to a normothermic control group and after (B) 24 hours of 0.2% O2 or 8% O2 oxygen tension compared to an atmospheric normoxic control group at 21% O2 (n=3–6, *p<0.05).
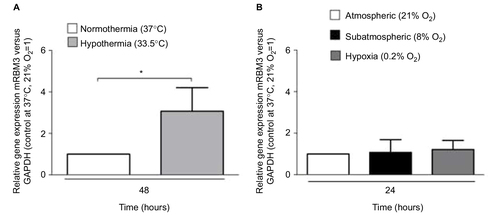
Figure 6 Expression of RBM3 mRNA in SK-N-SH exposed to 0.2% O2 (A) or 8% O2 (B) for 24 hours followed by normothermia/hypothermia for 24, 48, or 72 hours (total 48, 72 and 96 hours, n=3, *p<0.05).
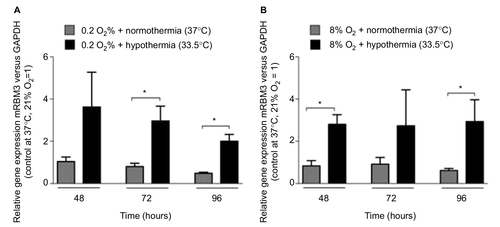
Figure 7 Western blots and densitometric quantification of RBM3 protein versus beta-actin in SK-N-SH after (A) 48 hours of normothermia (37°C) versus hypothermia (33.5°C) and after (B) 24 hours of 0.2% or 8% O2 tension compared to 24 hours of atmospheric normoxia (n=4–8, *p<0.05).
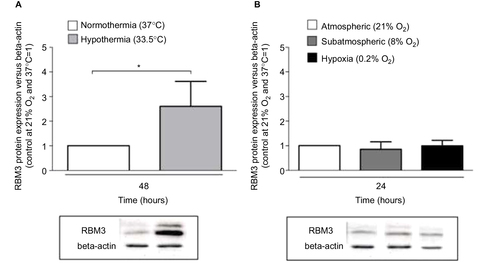
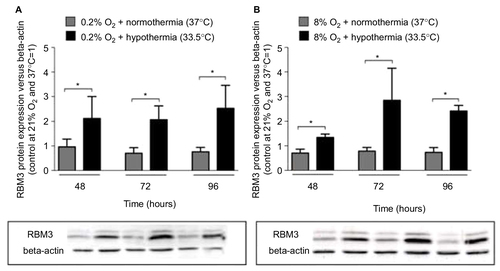
Figure 8 Western blots and densitometric quantification of RBM3 protein versus beta-actin in SK-N-SH cells after (A) 24 hours of hypoxia (0.2% O2) or (B) 24 hours of subatmospheric oxygen tension (8% O2) followed by 24, 48, or 72 hours of normothermia/hypothermia (total 48, 72 and 96 hours, n=4, *p<0.05).