
Figures & data
Table 1 Endothelial Cell Microvascular Obstructive Responses To Acute Hypoxia
Table 2 Other Microvascular Obstructive Responses To Acute Hypoxia
Table 3 Microvascular Obstructive Responses To Low Shear Stress
Figure 1 Cycle of reperfusion microvascular ischemia (RMI) and obstructive responses. Effective increase in O2 delivery attenuates both limbs of the cycle, with improvement of microvascular blood flow, viability, and function. Pathogenetic mechanisms associated with lethal reperfusion injury can be better assessed after RMI has been effectively treated.
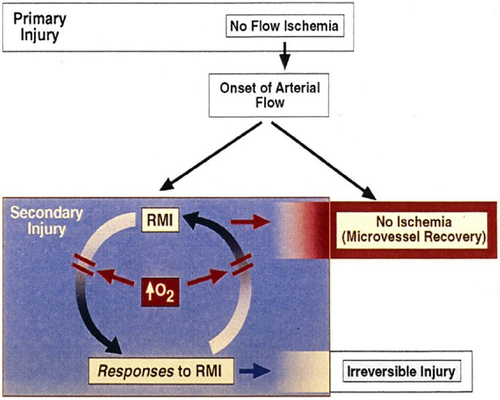
Figure 2 Transmission electron microscopy (TEM) of porcine myocardium at 3 hrs of reperfusion following 1 hr of coronary occlusion. Representative images from control (left panel) and SSO2-treated (right panel) groups (masked assignment selection by cardiac pathologist [Vander Heide R]) (data from Spears et al,Citation117). EC = Endothelial Cell. RBC = Red Blood Cell (within lumen of EC). EC edema, loss of EC nuclei, and prominent disruption of myofibrillar structure was evident in the Control group only. Reprinted by permission from Springer Nature (Springer Nature) (Am J Cardiovasc Drugs) (Hyperoxemic perfusion for treatment of reperfusion microvascular ischemia in patients with myocardial infarction) Bartorelli AL., Copyright (2003).Citation120
![Figure 2 Transmission electron microscopy (TEM) of porcine myocardium at 3 hrs of reperfusion following 1 hr of coronary occlusion. Representative images from control (left panel) and SSO2-treated (right panel) groups (masked assignment selection by cardiac pathologist [Vander Heide R]) (data from Spears et al,Citation117). EC = Endothelial Cell. RBC = Red Blood Cell (within lumen of EC). EC edema, loss of EC nuclei, and prominent disruption of myofibrillar structure was evident in the Control group only. Reprinted by permission from Springer Nature (Springer Nature) (Am J Cardiovasc Drugs) (Hyperoxemic perfusion for treatment of reperfusion microvascular ischemia in patients with myocardial infarction) Bartorelli AL., Copyright (2003).Citation120](/cms/asset/edde9740-4c87-416a-88cb-1e45060e3fa1/dhpx_a_12195791_f0002_b.jpg)
Figure 3 Representative histologic sections of porcine myocardium stained with both propidium iodide (red fluorescence of all nuclei, left column) and terminal deoxynucleotidyl transferase dUTP nick end labeling of apoptotic cells (green fluorescence; DeadEndTM Fluorometric TUNEL System, Promega)(middle column).Citation115 Superimposition of the fluorescent images in right column (Dual). Normal = myocardium not subjected to ischemia (top row). Control AutoRP = 3 hrs of reperfusion (AutoRP = passive reperfusion) after one hour ischemia (LAD occlusion)(middle row). SSO2 = 3 hrs of reperfusion after one hour ischemia (LAD occlusion), with SSO2 perfusion performed for 90 mins, 15 mins after the onset of reperfusion (bottom row). Apoptosis, in a heterogeneously distributed pattern (green dots), was noted in each Control AutoRP animal (n = 3) and in none of the animals in the Normal group (n = 3) and the SSO2 group (n = 3).
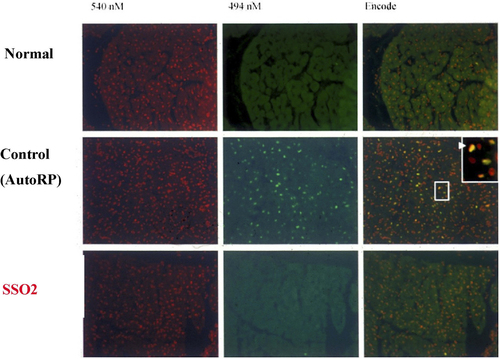
Table 4 Observed Effects Of HBOT/SSO2 On Reperfused Tissues. The Effects Are Consistent With Attenuation Of RMI