Figures & data
Table 1 Clinical and Demographic Data for Pediatric Subjects
Table 2 Clinical and Demographic Data for Adult Subjects
Figure 1 Analysis of colon HIF-1a and MIP-3α in pediatric IBD colitis. In panel A, biopsy tissue lysates from pediatric non-colitis controls (n=7) and pediatric subjects with active IBD colitis (n=9) were used to quantify HIF-1a protein by electrochemiluminescent-based ELISA and presented as mean±SEM relative light units/µg total protein where * is p<0.05. In panel B, total RNA was isolated from colonic biopsies derived from pediatric non-colitis controls (n=7) and pediatric subjects with active IBD colitis (n=9). Quantitative PCR was used to analyze MIP-3α mRNA levels. Data are expressed as mean±SEM transcript level derived from the differential threshold cycle number (2e-∆CT) and normalized to healthy controls where * is p<0.05. In panel C, biopsy tissue lysates were used from pediatric non-colitis controls (n=7) and pediatric subjects with active IBD colitis (n=10) to quantify MIP-3α protein by electrochemiluminescent-based ELISA and presented as mean±SEM pg MIP-3α/ug total protein where ** is p<0.01.
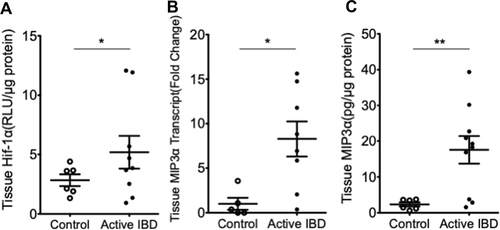
Figure 2 Serum hypoxia marker levels in pediatric IBD colitis. Serum samples from healthy control (n=17) and pediatric subjects with active IBD colitis (n=17) were used to quantify MIP-3α (panel A), VEGF (panel B), or EPO (panel C) protein by electrochemiluminescent-based ELISA and presented as mean±SEM pg/mL where * is p<0.05 and ** is p<0.01.
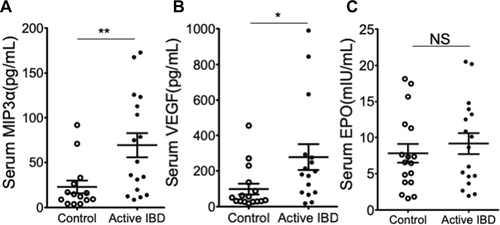
Figure 3 Analysis of pediatric serum hypoxia markers in relation to colonic tissue histology. The upper panels (A) depict representative 200x magnification images of hematoxylin and eosin-stained histopathologic tissue used to subgroup patients into normal (score 0), mild (score 1), moderate (score 2), or severe colitis (score 3). In the bottom panels (B–D), serum samples from non-colitis controls (n = 17) and histologic subgroups of pediatric subjects with active IBD colitis were used to quantify (from left to right) MIP-3α, VEGF, and EPO protein by electrochemiluminescent-based ELISA and presented as mean±SEM pg/mL where * is p<0.05, ** is p<0.01 and *** is p<0.001.
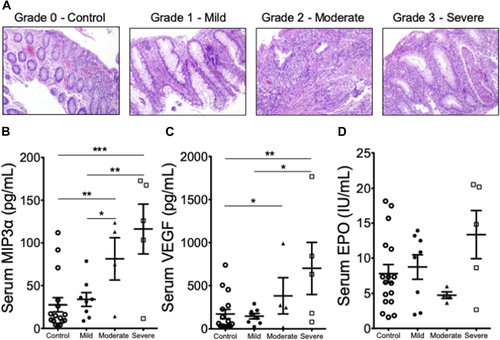
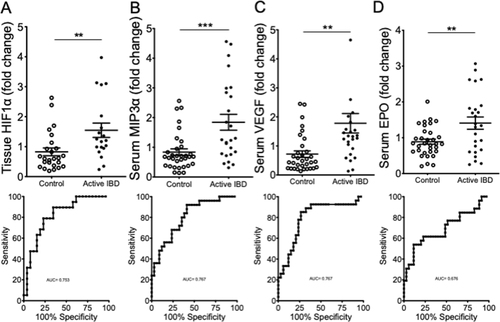
Figure 4 Tissue HIF-1α and serum hypoxia markers in adult ulcerative colitis. Colon biopsies and serum samples from healthy adult controls (n = 19), inactive UC subjects (n = 10) and active UC subjects (n=10) were used to quantify colon HIF-1a (panel A), serum MIP-3α (panel B), serum VEGF (panel C) and serum EPO (panel D) protein by electrochemiluminescent-based ELISA and presented as mean±SEM RLU/µg or pg/mL where ** is p<0.01 and *** is p<0.001.
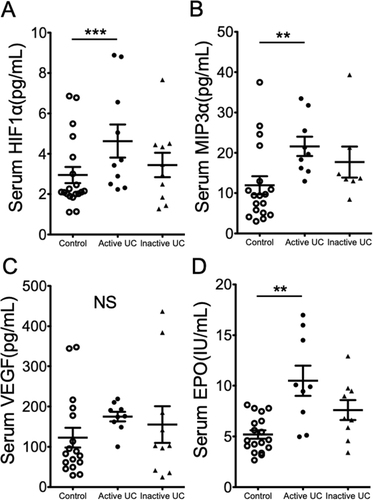
Figure 5 ROC curve analysis of tissue HIF-1α and serum hypoxia markers in pediatric and adult IBD. Colon biopsies (panel A) and serum samples (panels B-D) from healthy pediatric and adult controls (n= 26 for panel A and n= 36 for panels B-D) and pediatric and adult IBD subjects (n= 20 for panel A and n= 27 for panels B-D) were used to quantify colon HIF-1a (top panel A), serum MIP-3α (top panel B), serum VEGF (top panel C) and serum EPO (top panel D) protein. Samples were normalized to control values and are presented as mean±SEM where ** is p<0.01 and *** is p<0.001. Bottom panels depict ROC curve analysis for individual hypoxia biomarkers with AUC values.