Figures & data
Figure 1 Effect of human plasma on Staphylococcus aureus biofilm formation.
Notes: S. aureus biofilms were cultured statically for (A) 24 hours or (B) 48 hours in tryptic soy broth supplemented with varying concentrations of human plasma and then quantified using the crystal violet assay. Six strains of S. aureus were tested, and values represent the mean + standard deviation of three to four independent experiments with six technical replicates per condition. Data were analyzed using one-way ANOVA followed by Dunnett’s multiple comparisons tests. *P≤0.05 compared to the respective 0% plasma group.
Abbreviations: OD, optical density; ANOVA, analysis of variance.
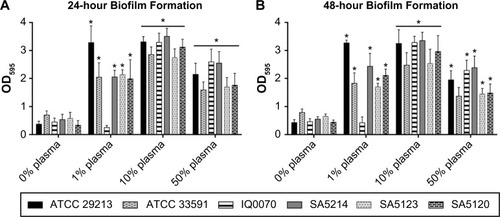
Figure 2 Dispersion of Staphylococcus aureus biofilms with 2-hour enzymatic treatments.
Notes: S. aureus biofilms were cultured for 24 hours in tryptic soy broth with 10% human plasma and then treated for 2 hours with α-amylase, bromelain, lysostaphin, or papain. The crystal violet assay was used to determine the total biomass remaining following the 2-hour treatment. Six strains of S. aureus were tested, and values represent the mean + standard deviation of three independent experiments with six technical replicates per condition. Data were analyzed with one-way ANOVA followed by Dunnett’s multiple comparisons tests. *P≤0.05 compared to the respective vehicle control group.
Abbreviation: OD, optical density
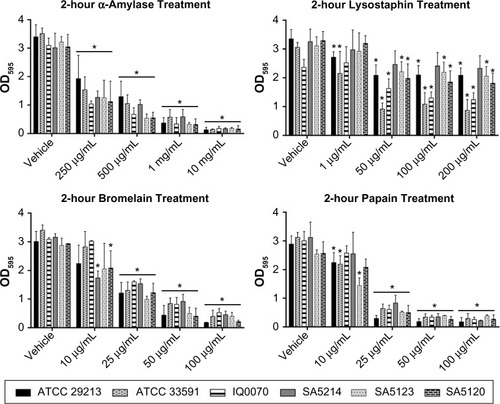
Figure 3 Visualization of dispersal enzyme effect on Staphylococcus aureus biofilms.
Notes: MRSA SA5120 biofilms were grown for 24 hours on glass coverslips and then treated for 2 hours with vehicle, α-amylase (1 mg/mL), bromelain (50 μg/mL), lysostaphin (200 μg/mL), or papain (50 μg/mL). Scanning electron microscopy was used to image the biofilms, and representative images from three independent experiments are shown. Left column: images at 5,000× magnification with the scale bar set at 4 μm. Right column: images at 30,000× magnification with the scale bar set at 400 nm.
Abbreviation: MRSA, methicillin-resistant S. aureus.
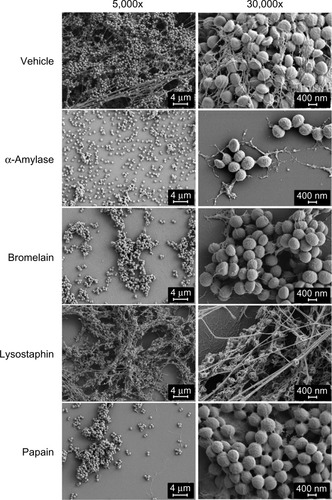
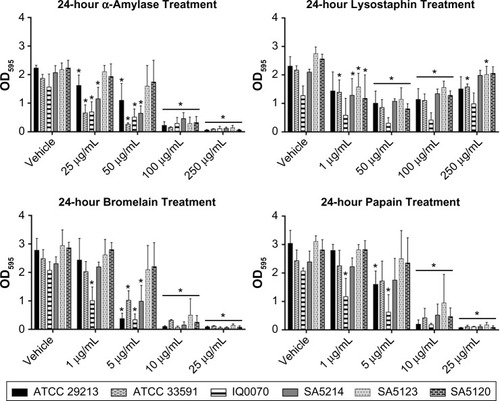
Figure 4 Degradation of Staphylococcus aureus biofilms after 24-hour treatment with dispersal agents.
Notes: Biofilms were cultured for 24 hours in tryptic soy broth with 10% human plasma and then treated with α-amylase, lysostaphin, bromelain, or papain for 24 hours. The crystal violet assay was used to determine the total biomass remaining after the 24-hour treatment. Six strains of S. aureus were tested, and values represent the mean + standard deviation of four independent experiments with six technical replicates per condition. Data were analyzed with one-way ANOVA followed by Dunnett’s multiple comparisons tests. *P≤0.05 compared to the respective vehicle control group.
Abbreviations: OD, optical density; ANOVA, analysis of variance.