Figures & data
Table 1 Parasitological assessment
Table 2 Distribution slope half-life
Table 3 Summary of time to clear 50%, 90%, 95%, and 99% of parasitemia (hours)
Figure 1 Parasite clearance curves (n=10).
Notes: Black dots represent measurements used in the estimation of clearance rate. Red dots represent outliers excluded from calculation. Green dots represent measurements below the level of detection.
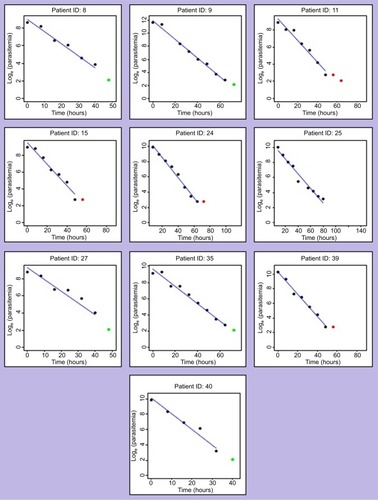
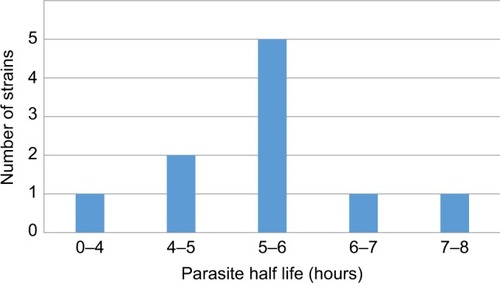
Figure 2 Distribution of parasite half-lives.