Figures & data
Table 1 Distribution of bacteria causing VAP according to their antibiotic susceptibility patterns
Table 2 Temporal distribution of bacteria causing VAP (number of isolates) over 12-month period from July 2015 to July 2016
Figure 1 Antibiotic consumption in the ICU of our facility during the study period (July 2015–July 2016) reported in DDD/100 BD.
Note: x-axis, type of antimicrobial; y-axis, DDD/1000 bed days.
Abbreviations: AMG, aminoglycosides; BD, bed day; CAR, carbapenems; CAZ, ceftazidime; CRO, ceftriaxone; CST, colistin; DDD, defined daily dose; FEP, cefepime; FQ, fluoroquinolones; GLY, glycopeptides (vancomycin and teicoplanin); ICU, intensive care unit; LZD, linezolid; TGC, tigecycline; TZP, piperacillin/tazobactam.
Abbreviations: AMG, aminoglycosides; BD, bed day; CAR, carbapenems; CAZ, ceftazidime; CRO, ceftriaxone; CST, colistin; DDD, defined daily dose; FEP, cefepime; FQ, fluoroquinolones; GLY, glycopeptides (vancomycin and teicoplanin); ICU, intensive care unit; LZD, linezolid; TGC, tigecycline; TZP, piperacillin/tazobactam.
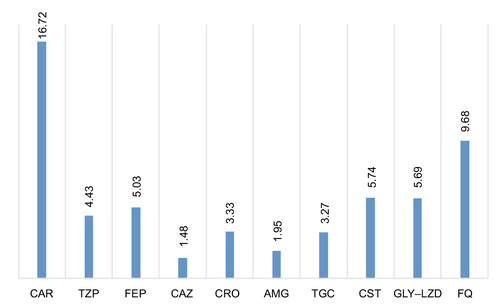
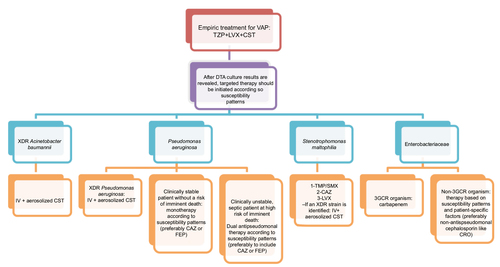
Figure 2 Our proposed treatment algorithm for empiric and targeted treatment of VAP.
Abbreviations: A. baumannii, Acinetobacter baumannii; CAZ, ceftazidime, CRO, ceftriaxone; CST, colistin; DTA, deep tracheal aspirate; FEP, cefepime; IV, intravenous; LVX, levofloxacin; P. aeruginosa, Pseudomonas aeruginosa; S. maltophilia, Stenotrophomonas maltophilia; TMP/SMX, trimethoprim/sulfamethoxazole; TZP, piperacillin/tazobactam; VAP, ventilator-associated pneumonia; XDR, extensively drug resistant; 3GCR, third-generation cephalosporin resistant.