Figures & data
Table 1 Characteristics of studies included in the meta-analysis
Figure 1 Flow chart of study selection in this meta-analysis.
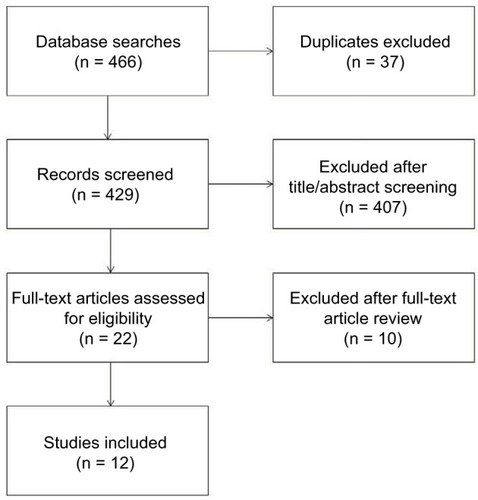
Figure 2 Analysis of sensitivity and specificity of Xpert MTB/RIF assay. Forest plots of sensitivity and specificity of the assay in (A) diagnosing musculoskeletal TB and (B) detecting RIF-resistance. Point estimates of sensitivity and specificity from each study are shown as solid circles. Error bars indicate 95% confidence interval.
Abbreviation: CI, confidence interval.
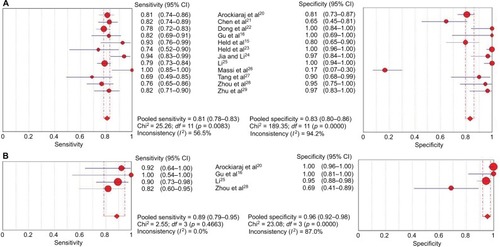
Figure 3 SROC curves of Xpert for the (A) diagnosis of musculoskeletal TB and (B) detection of RIF resistance. The size of each solid circle represents the sample size of individual study. The regression SROC curves summarize the overall diagnostic accuracy.
Abbreviations: SROC, summary receiver operating characteristic; TB, tuberculosis; RIF, rifampicin; AUC, area under the curve; SE, standard error.
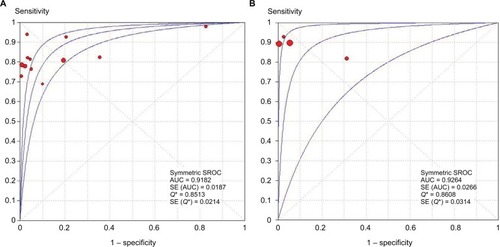
Table 2 Subgroup analysis of the results of Xpert for detecting musculoskeletal TB
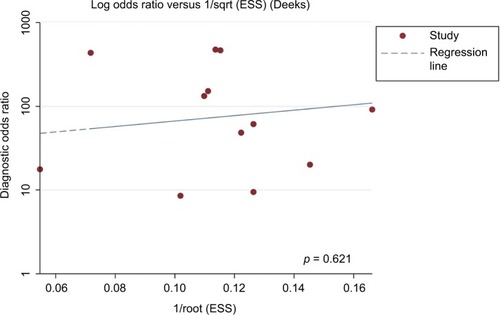
Figure 4 Deeks’ funnel plot indicating no significant risk of publication bias (p = 0.621). Solid circles represent each study included in the meta-analysis.
Abbreviation: ESS, effective sample size.