Figures & data
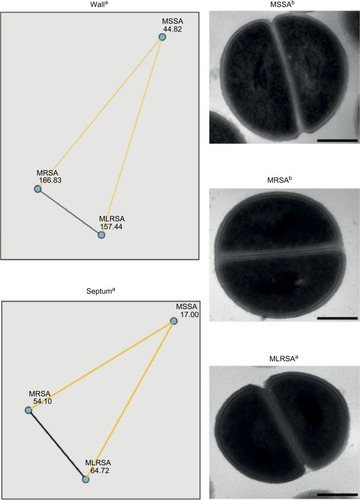
Figure 1 Graphical representation of Dunn–Bonferroni’s nonparametric pairwise comparison for post hoc testing after a significant Kruskall–Wallis test of MSSA, MRSA, and MLRSA wall and septum measurements, and TEM images of a representative example of each group.
Notes: aNumerical values represent the mean rank of each group. Yellow lines represent statistically significant (P<0.05) comparisons between the groups they connect. Black lines represent nonsignificant (P≥0.05) comparisons between the groups they connect. bMagnification: 1,50,000×. Scale bar: 200 nm.
Abbreviations: MLRSA, methicillin- and linezolid-resistant Staphylococcus aureus; MRSA, methicillin-resistant S. aureus; MSSA, methicillin-sensitive S. aureus; TEM, transmission electron microscopy.