
Figures & data
Table 1 Identification results of the sample strains using different methods
Table 2 Aspergillus fumigatus identification by VITEK MS V 3.0 (a total of 46 strains)
Table 3 Identification results for proteins stored at different temperatures for various time periods
Figure 1 Proteins stored at 4°C.
Note: The 0 h, 48 h, 72 h, 120 h, and 168 h groups, respectively, are presented from bottom to top.
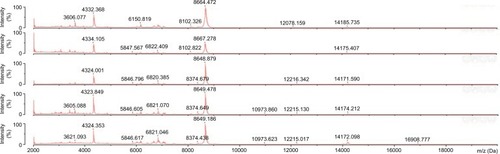
Figure 2 Proteins stored at −20°C.
Note: The 0 h, 48 h, 72 h, 120 h, and 168 h groups, respectively, are presented from bottom to top.
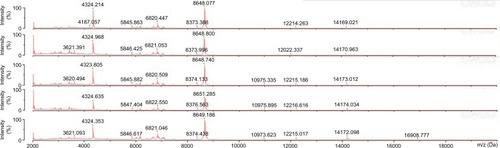
Figure 3 Proteins stored at −80°C.
Note: The 0 h, 48 h, 72 h, 120 h, and 168 h groups, respectively, are presented from bottom to top.
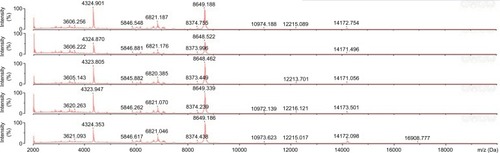
Table 4 Types of RSP used in this study