
Figures & data
Table 1 Biofilm-related resistance and FLIP7–antibiotic interaction in biofilms (TTC assay)
Table 2 FLIP7 and antibiotics interaction on planktonic cells (TTC assay)
Figure 1 Doze–effect curves of antibiotics alone and in combination with FLIP7 against Staphylococcus aureus biofilm (TTC assay).
Abbreviations: TTC, trimethyl tetrazolium chloride; OD, optical density; BRR, biofilm-related resistance; FICI, fractional inhibitory concentration index.
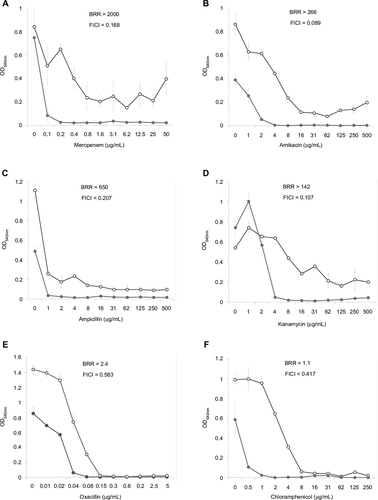
Figure 2 Doze–effect curves of antibiotics alone and in combination with FLIP7 against Escherichia coli biofilm (TTC assay).
Abbreviations: TTC, trimethyl tetrazolium chloride; OD, optical density; BRR, biofilm-related resistance; FICI, fractional inhibitory concentration index.
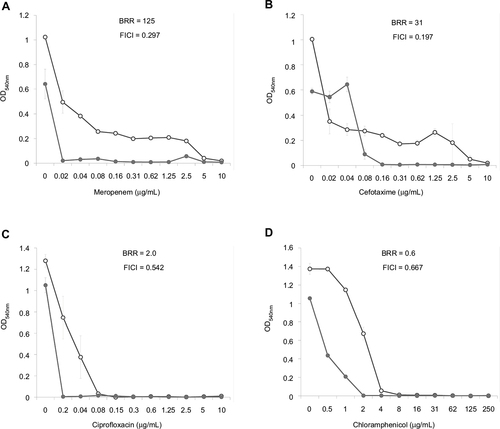
Table 3 FLIP7 and antibiotics interaction in crystal violet biofilm eradication assay
Figure 3 Doze–effect curves of antibiotics alone and in combination with FLIP7 against Staphylococcus aureus biofilm (crystal violet assay).
Abbreviation: OD, optical density.
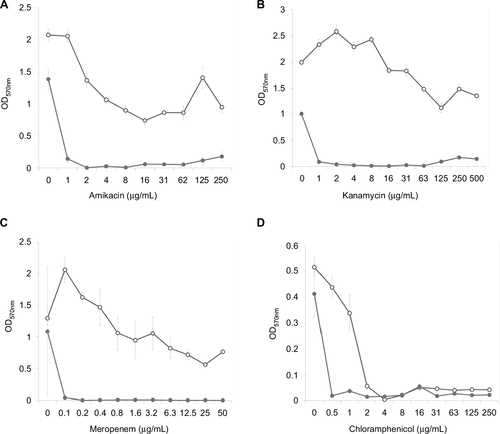
Figure 4 Doze–effect curves of antibiotics alone and in combination with FLIP7 against Escherichia coli biofilm (crystal violet assay).
Abbreviation: OD, optical density.
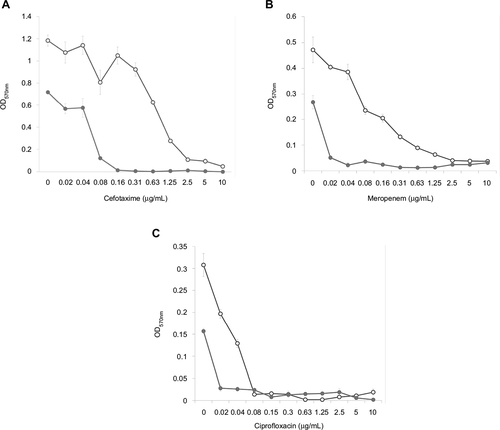
Figure 5 Staphylococcus aureus biofilm microscopic visualization (Nomarski optics ×1000).
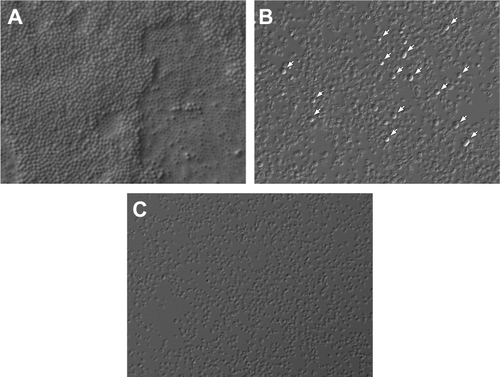
Table 4 Pharmacological windows of antibiotics used in combination with FLIP7