
Figures & data
Figure 1 The sketch of PD parameters.
Abbreviations: –1KT, –1Log kill time; –2KT, –2Log kill time; –3KT, –3Log kill time; SRT, regrowth recovery time; +1RT, +1Log growth time; AAKC, area above kill curve; AST, analysis start time; MKD, maximum kill down; MKT, maximum kill time; PD, pharmacodynamics; RT, bacterial growth recovery time; TAAKC, total area above kill curve; T–1KT, total –1Log kill time.
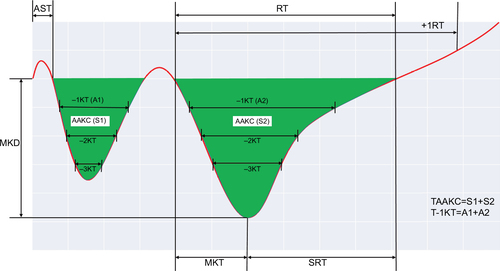
Table 1 Characteristics of three KPC-producing Klebsiella pneumoniae strains
Figure 2 In vitro dynamic model time–kill assays using concentrations of FM, AMK, and COL (either alone or in combination) against three CR-Kp strains.
Notes: (A) and (B) monotherapy or combination therapy, respectively, against isolate 2887; (C) and (D) monotherapy or combination therapy, respectively, against isolate 3155; (E) and (F) monotherapy and combination therapy, respectively, against isolate 18253. The dotted lines indicate monotherapy, and the solid lines indicate combination therapy. Antibiotic concentrations are denoted by different symbols.
Abbreviations: AMK, amikacin; COL, colistin; CR-Kp, colistin-resistant Klebsiella pneumoniae; FM, fosfomycin; q8h, every 8 hours; q12h, every 12 hours; qd, once daily.
Abbreviations: AMK, amikacin; COL, colistin; CR-Kp, colistin-resistant Klebsiella pneumoniae; FM, fosfomycin; q8h, every 8 hours; q12h, every 12 hours; qd, once daily.
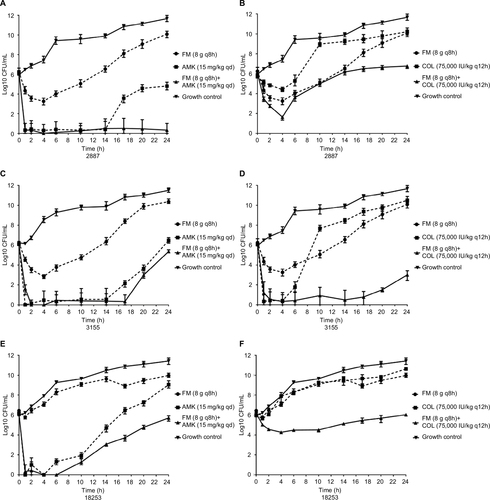
Table 2 PD parameters of different regimens against the three KPC-producing Klebsiella pneumonia
Figure S1 (A–F) The time–concentration curves of antibiotics in the Pharmacokinetics Auto Simulation System 400.
Abbreviations: FM, fosfomycin; AMK, amikacin, COL, colistin; q8h, every 8 hours; q12h, every 12 hours; qd, once daily.
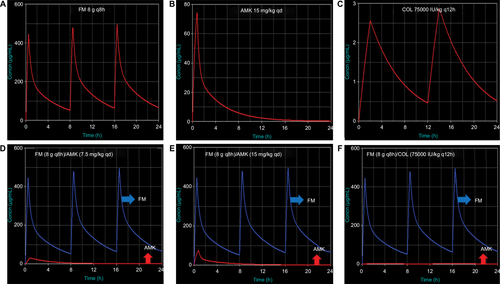
Figure S2 Pharmacokinetics Auto Simulation System 400.
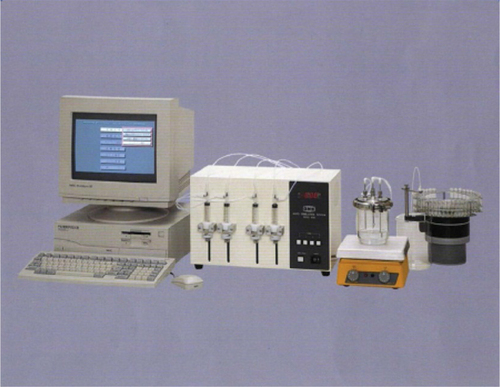
Table S1 PK parameters of different regimens