
Figures & data
Figure 1 Analytical RP-HPLC chromatogram of the synthetic hybrid peptide H4 displaying a purity of >95%.
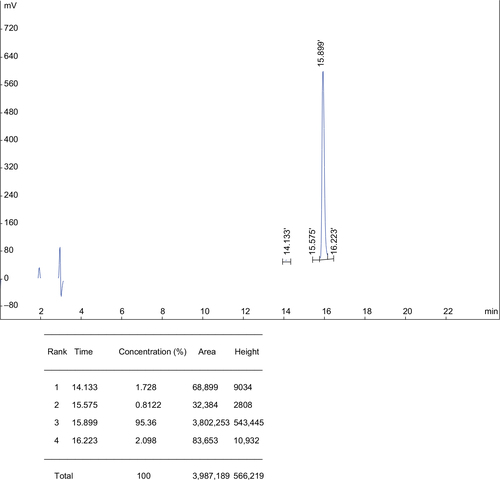
Figure 2 Positive ESI-MS analysis of the synthetic peptide H4 showing major peaks in the +4, +5, +6, and +7 charge states of 910.27, 728.38, 607.16, and 520.68 Da, respectively.
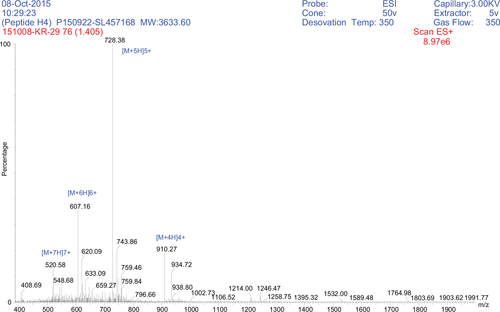
Table 1 NPS HNN secondary structure analysis and percentage helicity generated for BMAP-27, OP-145, and the hybrid peptide H4 in addition to the α-helical fragments identified from each peptide
Table 2 The calculated mean hydrophobicity <H>, hydrophobic moment <µH>, and net charge of BMAP-27, OP-145, and the hybrid peptide H4
Figure 3 Three-dimensional structural modeling of H4. Red regions correspond to helical structures within the peptide, while the green regions represent hinged regions and unordered conformations, respectively. The structure was visualized using Accelrys Discovery Studio software.
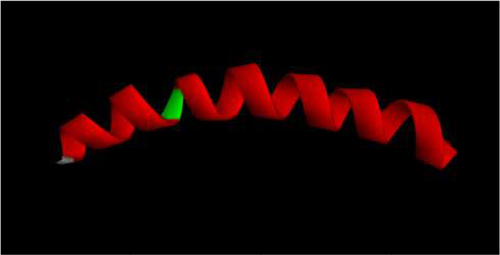
Table 3 MICs of H4 against all the microbial strains employed in this study
Table 4 MICs of individual antibiotics and those in combination with H4 including the percentage reduction of antibiotic MIC when in combination; MICs of individual H4 and those in antibiotic combination; and the FIC indices for the antimicrobial combinations against the tested bacterial species
Table 5 Antibiofilm activity of H4 against standard resistant strains of Staphylococcus aureus (BAA41) and Pseudomonas aeruginosa (BAA2114)
Table 6 Hemolytic activity of H4 against human erythrocytes after 1 hour of exposure to the peptide
Figure 4 Cell survival curves as measured by MTT assay for H4 against two normal mammalian cell lines, Vero and HEK293. Cells were incubated with various concentrations of the peptides, for 24 hours, at 37°C. Control cells represent 100% proliferation, and the mean absorbance of treated cells was related to control values to determine sensitivity. Error bars represent standard error from mean cell proliferation as determined by repeated experiments.
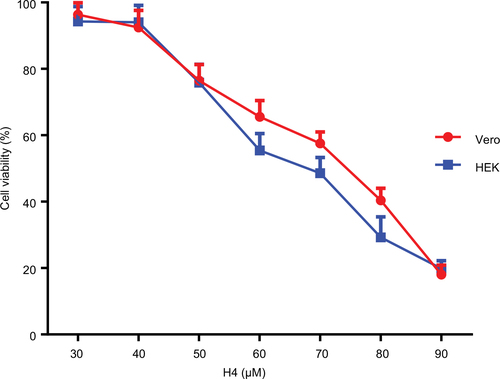
Table 7 Cytotoxicity effects (IC50 value) using MTT assay of H4 on two eukaryotic mammalian cell lines (HEK293 and Vero)