Figures & data
Figure 1 Peptide dendrimers dG3KL and dTNS18 tested in the present study.
Abbreviation: MS, mass spectrometry (to assess molecular weight).
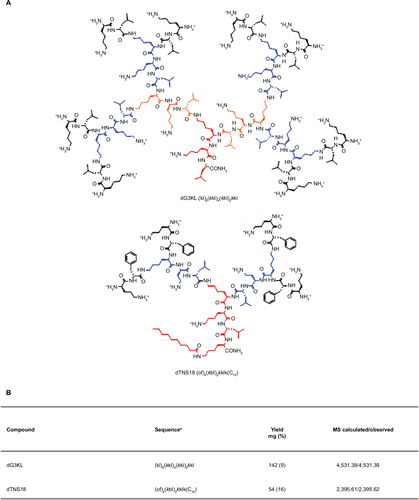
Table 1 In vitro antibacterial activity of dendrimer peptides compared to Tob against Pseudomonas aeruginosa strains from CF patients
Figure 2 Time–kill kinetics of dendrimers and Tob against Pseudomonas aeruginosa.
Abbreviations: MIC, minimum inhibitory concentration; Tob, tobramycin.
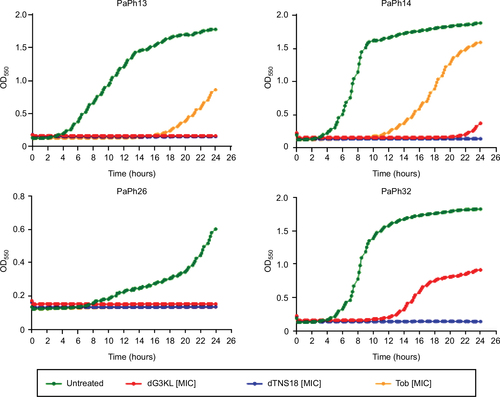
Figure 3 Screening for biofilm formation by Pseudomonas aeruginosa.
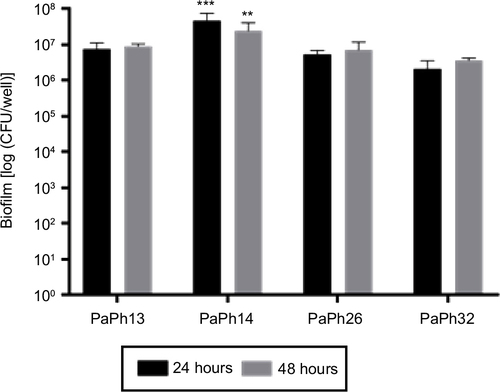
Figure 4 Effect of dendrimers and Tob on Pseudomonas aeruginosa-biofilm formation.
Abbreviations: MIC, minimum inhibitory concentration; Tob, tobramycin.
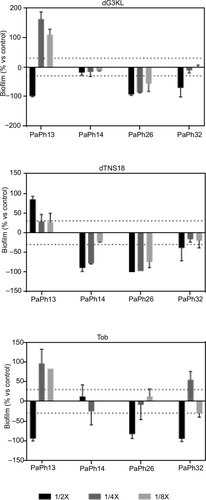
Figure 5 Pseudomonas aeruginosa-biofilm dispersion caused by dendrimers and Tob.
Abbreviations: MIC, minimum inhibitory concentration; Tob, tobramycin.
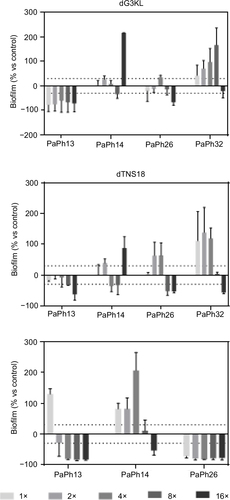
Figure 6 In vitro activity of peptides and Tob against viability of preformed biofilm by Pseudomonas aeruginosa.
Abbreviations: MIC, minimum inhibitory concentration; Tob, tobramycin.
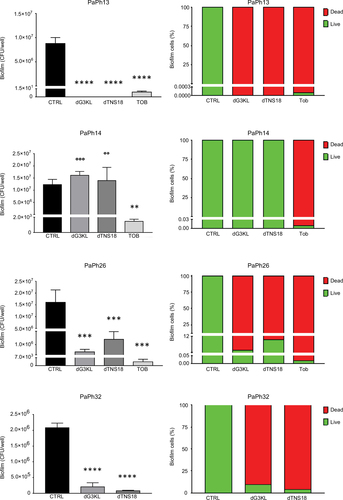
Figure 7 In vivo toxicity assays.
Abbreviations: MIC, minimum inhibitory concentration; Tob, tobramycin.
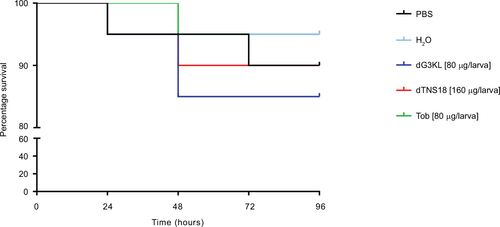
Figure 8 In vivo Pseudomonas aeruginosa-killing assays.
Abbreviation: LD50, lethal dose 50.
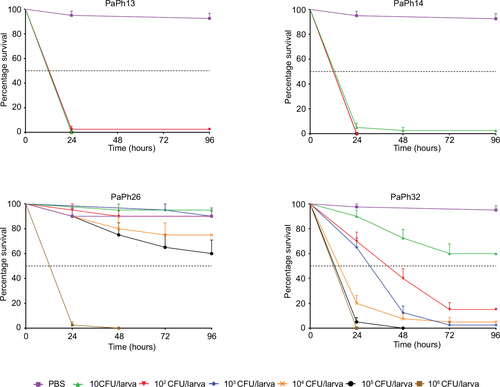
Figure 9 In vivo protection against systemic Pseudomonas aeruginosa (Pa) infection.
Abbreviations: MIC, minimum inhibitory concentration; Tob, tobramycin; LD50, lethal dose 50.
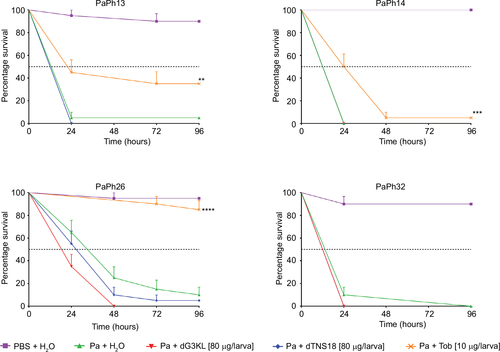
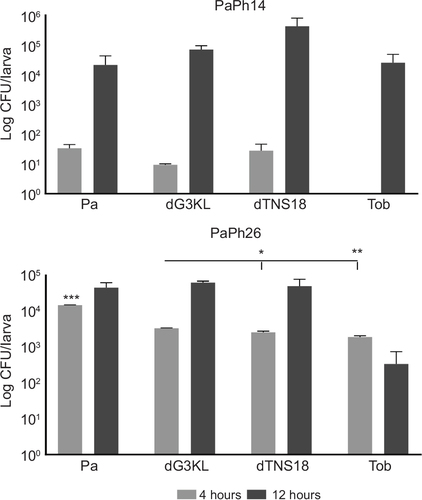
Figure 10 Kinetics of Pseudomonas aeruginosa (Pa) growth in Galleria mellonella hemolymph.
Abbreviations: MIC, minimum inhibitory concentration; Tob, tobramycin.