Figures & data
Figure 1 Schematic demonstrating the interactive transmission dynamics of (A) mosquito and (B) human population dynamics.
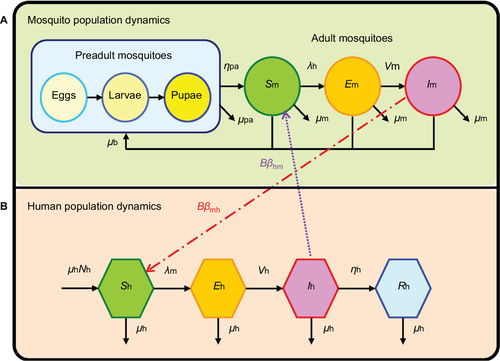
Table 1 Input parameters of DALYs estimations
Figure 2 Monthly time-series estimates in temperature and total DALYs in 2001–2014, where the symbols diamond, square, and triangle represent monthly maximum, mean, and minimum temperatures, respectively.
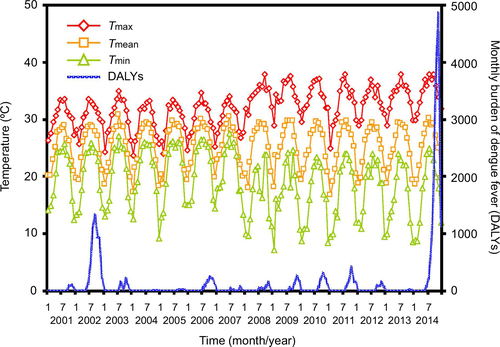
Figure 3 Relationships showing temperature dependency for (A) extrinsic incubation rate, (B) female mosquito death rate, and (C) larvae survival percentage used in vector-host interactive transmission model.
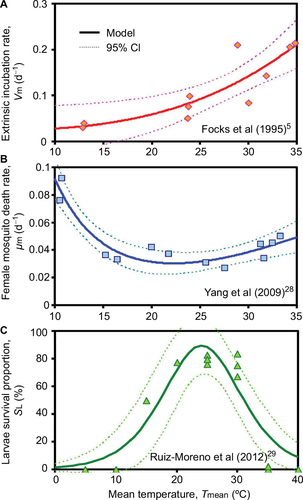
Table 2 Parameters and equations used to estimate temperature-dependent basic reproduction number (R0)
Figure 4 Uncertainty and sensitivity analysis of fractional parameter contribution to variance of temperature-dependent R0.
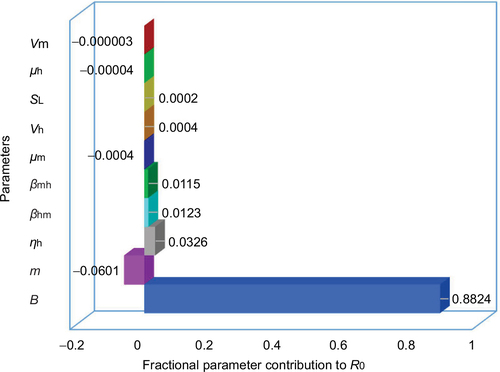
Figure 5 Three-dimensional interactive diagrams demonstrating relationships among monthly average temperature, R0, and DALYs in seasons (A) summer, (B) fall, (C) winter, and (D) all seasons, respectively.
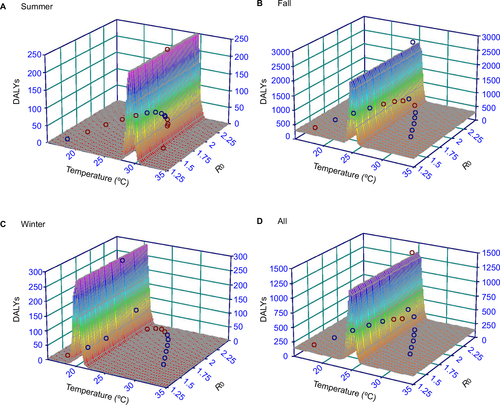
Table 3 Optimal fitted three-dimensional models describing temperature–R0–DALYs relationshipa
Figure 6 Box-and-Whisker plots showing estimated median and range values for (A) season-varied temperature and (B) R0. Exceedance risk profiles indicating season-based DALYs occurring with different risk probabilities in (C) summer, (D) fall, (E) winter, and (F) all seasons.
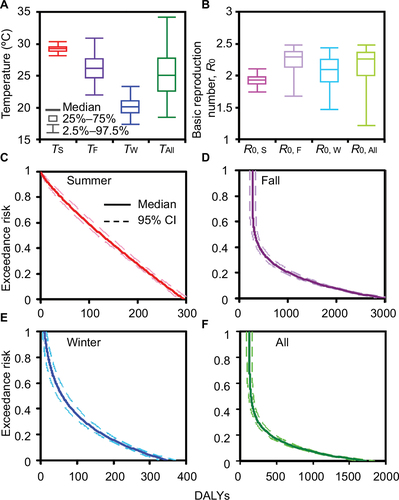
Table 4 Temperature and basic reproduction number (R0) variations-based DALYs with exceedance risks at 0.8, 0.5, and 0.2
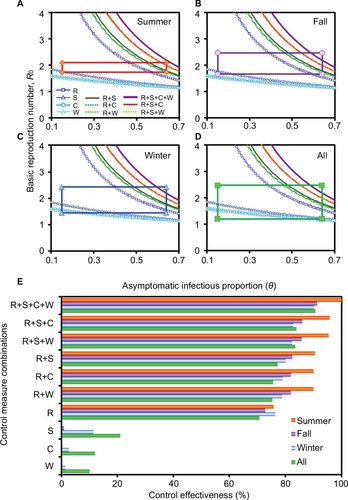
Figure 7 Multi-efficacy control curve constructed with R0, the asymptomatic infectious proportion, as well as various control efficacies for dengue outbreak containment in different seasons (A) summer, (B) fall, (C) winter, and (D) all seasons. Rectangular boxes showing 95% CIs of R0 and θ, respectively. (E) Control measure effectiveness was estimated based on combinations of different control efficacies for varied seasons.