
Figures & data
Table 1 bla genes detected by PCR in carbapenem resistant isolates
Table 2 Carbapenemase gene distribution among isolates, the corresponding meropenem MIC range and the effect of antimicrobial combination
Figure 1 Colistin/tigecycline combination test (Acinetobacter baumannii).
Abbreviation: MIC, minimum inhibitory concentration.
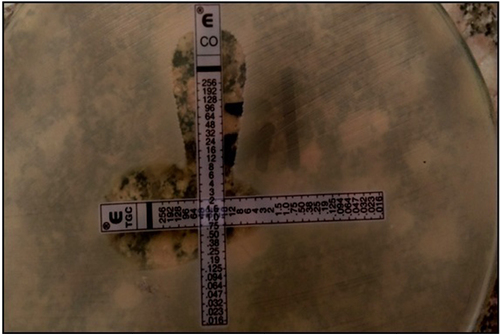
Table 3 The effect of colistin based combinations against Acinetobacter baumannii and Pseudomonas aeruginosa
Figure 2 Colistin/meropenem combination test (Pseudomonas aeruginosa).
Abbreviation: MIC, minimum inhibitory concentration.
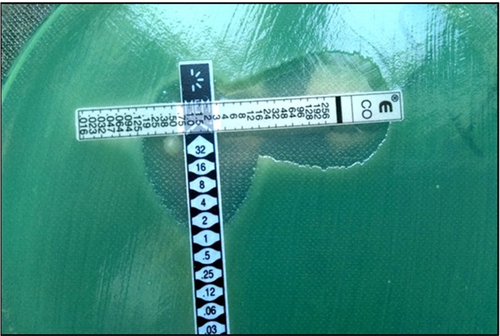
Table S1 Individual MIC values of tested agents, FIC values of tested combinations and corresponding carbapenemase gene/s for all Acinetobacter baumannii isolates
Table S2 Individual MIC values of tested agents, FIC values of tested combination and corresponding carbapenemase gene/s for all Pseudomonas aeruginosa isolates