
Figures & data
Table 1 In vitro antimicrobial activity of omadacycline against organisms in different studies
Table 2 Pharmacokinetic parameters of omadacycline in healthy adult subjects
Figure 1 Mean±SD plasma concentration-time curve of omadacycline after administration of 300 mg oral dose (open triangles) and 100 mg intravenous dose (closed circles) in healthy subjects.Note: Data from Sun et al.Citation23
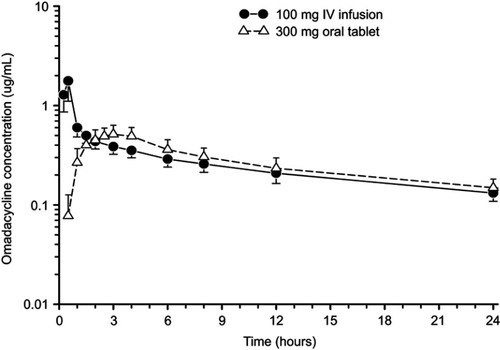
Figure 2 Mean±SD area under the plasma concentration-time curve (AUC) and maximum plasma concentration (Cmax) of omadacycline following oral administration of a 300 mg oral dose under fasting condition (solid black bar), when a standard high-fat non-dairy meal was ingested 4 hours pre-dose (solid gray bar), when a standard high-fat non-dairy meal was ingested 2 hours pre-dose (crossed line bar), and when a standard high-fat meal including dairy was ingested 2 hours pre-dose (confetti bar).Note: Data from Tzanis et al.Citation29
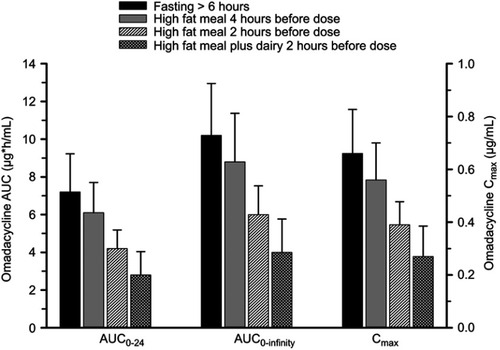
Figure 3 Mean±SD unbound plasma, epithelial lining fluid (ELF), and alveolar macrophages (AM) concentration-time curve of omadacycline, eravacycline, and tigecycline after multiple intravenous doses of 100 mg, 1 mg/kg, and 50 mg, respectively. Note that the duration of time represents the dosing interval of 24 hours for omadacycline and 12 hours for eravacycline and tigecycline.Note: Data from these studiesCitation30,Citation35
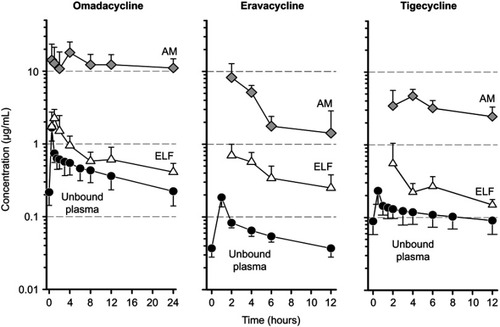
Table 3 Plasma AUC0–24/MIC ratios associated with net stasis and kill endpoints
Table 4 Primary and select secondary endpoints in the OASIS-1 study, a phase 3 clinical trial comparing non-inferiority of omadacycline vs linezolid for acute bacterial skin and skin-structure infections
Table 5 Primary and select secondary endpoints in the OPTIC study, a phase 3 clinical trial comparing non-inferiority of omadacycline vs moxifloxacin for community-acquired bacterial pneumonia
Table 6 United States food and drug administration identified breakpoints for omadacycline
Table 7 Safety outcomes of omadacycline and comparators in phase 2 and 3 studies for the treatment of different infections
Table 8 Dosage of omadacycline for adult patients with ABSSSI and CABP