Figures & data
Table 1 Antimicrobial drug susceptibility profiles
Table 2 Major features of plasmids analyzed
Table 3 Plasmids with pHN7A8/pKPC-LK30 hybrid structures
Figure 1 Linear comparison of plasmid genome sequences.
Notes: Genes are denoted by arrows. Genes, mobile elements, and other features are colored based on the function classification. Shading denotes the regions of homology (>95% nucleotide identity). Accession numbers of pCT-KPC and p675920-1Citation13 for reference are KT185451 and MF133495, respectively.
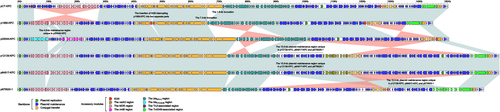
Figure 2 Deduced evolutionary history of major accessory resistance regions.
Notes: Shown are the deduced evolutionary history of the blaKPC-2 regions (a) and the MDR regions (b) of indicated plasmids. Circled numbers indicate different stages of evolution.
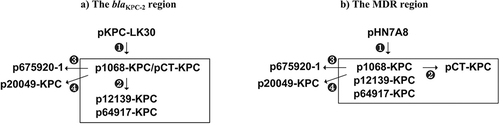
Figure 3 The blaKPC-2 regions and comparison with related regions.
Notes: Genes are denoted by arrows. Genes, mobile elements, and other features are colored based on the function classification. Shading denotes regions of homology (>95% nucleotide identity). Numbers in brackets indicate the nucleotide positions within the corresponding plasmids. Accession numbers of the IS26–blaSHV-12–IS26 unit, Tn6296, and Tn21 for reference are CP003684, FJ628167, and AF071413, respectively.
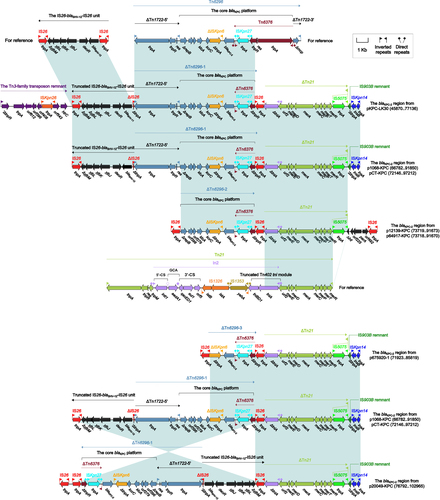
Figure 4 The MDR regions and comparison with related regions.
Notes: Genes are denoted by arrows. Genes, mobile elements, and other features are colored based on the function classification. Shading denotes regions of homology (>95% nucleotide identity). Numbers in brackets indicate the nucleotide positions within the corresponding plasmids.
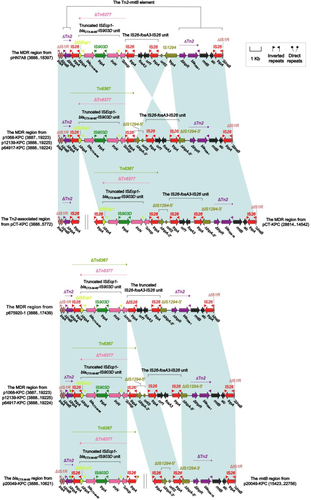
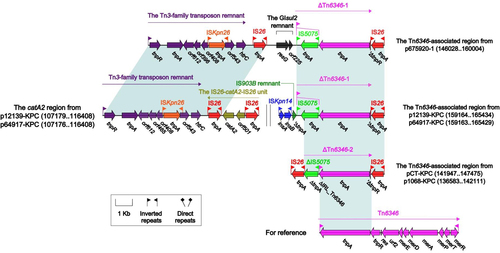
Figure 5 The Tn6346-associated regions and the catA2 regions and comparison with related regions.
Notes: Genes are denoted by arrows. Genes, mobile elements, and other features are colored based on the function classification. Shading denotes regions of homology (>95% nucleotide identity). Numbers in brackets indicate the nucleotide positions within the corresponding plasmids. Accession number of Tn6346 for reference is EU696790.