Figures & data
Figure 1 Species distribution and prior AFT by hospital department at the time of candidemia diagnosis.
Abbreviation: AFT, antifungal treatment.
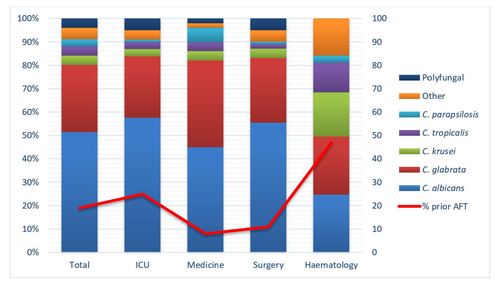
Table 1 Species distribution according to prior AFT
Table 2 AFT according to hospital department at the time of candidemia diagnosis
Figure 2 Proportion of patients receiving adequate treatment according to choice of initial antifungal agent.
Note: *100% of amphotericin B-treated cases were adequately treated in both initial and second AFT.
Abbreviation: AFT, antifungal treatment.
Abbreviation: AFT, antifungal treatment.
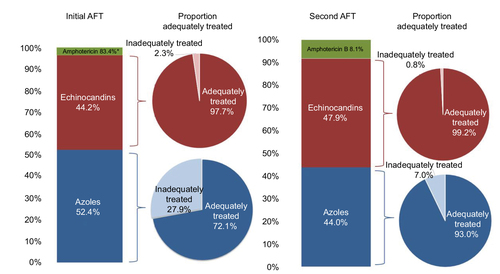
Table 3 Treatment and mortality
Table S1 Species distribution
Figure S1 Flow chart of the study population.
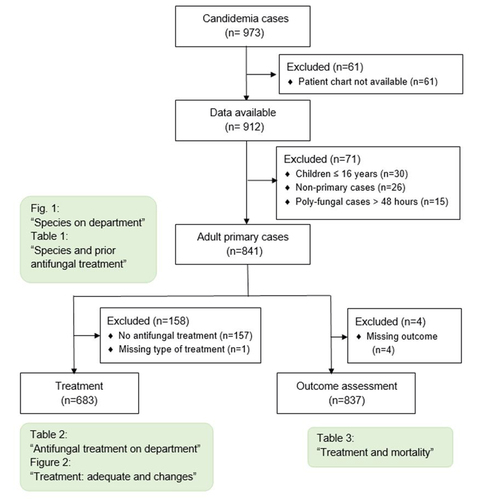
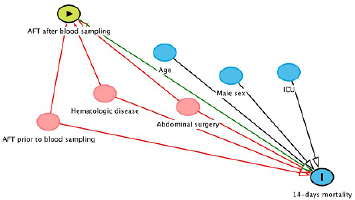
Figure S2 Directed Acyclic Graphs (DAG s): Prior antifungal treatment and 7-day mortality.
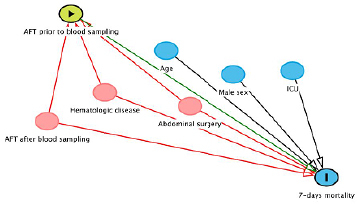
Figure S3 Directed Acyclic Graphs (DAGs) showing antifungal treatment after blood culture collection and 14-day mortality.