Figures & data
Table 1 Primers for QRT-PCR
Figure 1 Resistance of VA-RCAZ to CAZ.
Notes: (A) MIC of CAZ in VA-S and VA-RCAZ. Logarithmic phase of VA-S and VA-R 5 CAZ (10 colony-forming units) were incubated with 3% NaCl LB broth containing CAZ ranging from 0.05 to 100 μg/mL in microwell plate at 30°C for 16 hours. (B) Percent survival of VA-S and VA-RCAZ vs concentration of CAZ. Overnight VA-S and VA-RCAZ were incubated with CAZ (0, 1.5, 3.1, 6.25, 12.5, and 25 μg/mL) in M9 minimal medium plus NaAc (10 mM) at 30°C for 6 hours. (C) Growth curve of VA-S and VA-RCAZ. Overnight VA-S and VA-RCAZ were diluted to 1:100 using fresh 3% NaCl LB medium and grown in the indicated periods. OD600 of the bacterial cultures was measured at the indicated time. (D) Growth ability of VA-S and VA-RCAZ in the presence of different carbon sources. Overnight VA-S and VA-RCAZ were diluted to 1:100 using fresh 3% NaCl LB medium and grown with glucose, xylitol, fructose, sucrose, mannose, or maltose at 30°C for 10 hours. OD600 of the bacterial cultures was measured. Results (B–D) are displayed as mean ± SEM, and significant differences are identified as determined by Student’s t-test. *P<0.05, **P<0.01. At least three biologic repeats were carried out.
Abbreviations: CAZ, ceftazidime; LB, Luria–Bertani; VA-RCAZ, ceftazidime-resistant Vibrio alginolyticus; VA-S, ceftazidime-sensitive Vibrio alginolyticus.
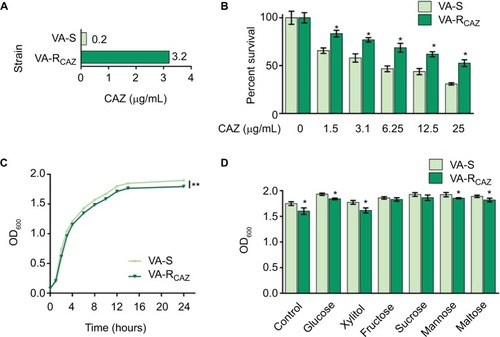
Figure 2 Metabolic profiles of VA-S and VA-RCAZ.
Notes: (A) Abundance of metabolites quantified in samples over two technical replicates is shown. Pearson correlation coefficient between technical replicates varies between 0.997 and 1.0. (B) Percentage of metabolites in every category. (C) Heat map of differential abundance of metabolites (row). Yellow and blue indicate increase and decrease of the metabolites scaled to mean and SD of row metabolite level, respectively (see color scale). Four biologic replicates in each group and two technical repeats for each biologic replicate were performed, yielding a total of 16 data sets. (D) Percentage of differential abundant metabolites in every category. (E) Number of differential abundant metabolites increased and decreased in every category. (F) Z-score plots corresponding to the data in panel (A). The data from VA-RCAZ are separately scaled to the mean and SD of VA-S. Each point represents one metabolite in one technical repeat and is colored by sample types (yellow: VA-S, blue: VA-RCAZ).
Abbreviations: VA-RCAZ, ceftazidime-resistant Vibrio alginolyticus; VA-S, ceftazidime-sensitive Vibrio alginolyticus.
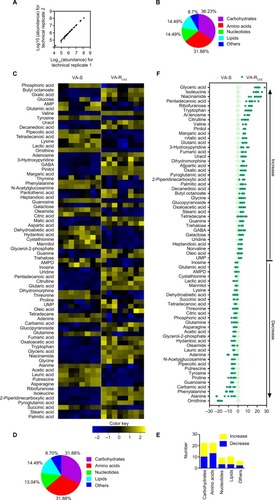
Figure 3 Pathway analysis.
Notes: (A) Pathway enrichment of differential abundant metabolites. (B) Integrative analysis of differential abundant metabolites in significantly enriched pathways. Yellow and blue indicate increase and decrease of metabolites, respectively. Number shows the differential abundant metabolites.
Abbreviations: VA-RCAZ, ceftazidime-resistant Vibrio alginolyticus; VA-S, ceftazidime-sensitive Vibrio alginolyticus.
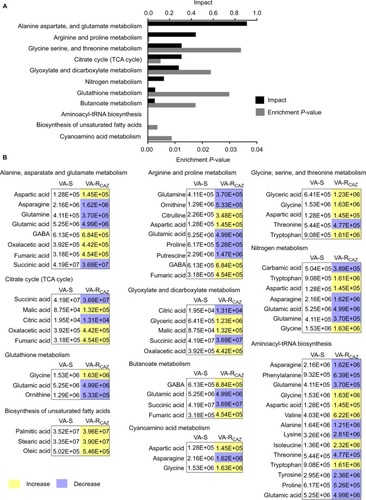
Figure 4 Metabolites up- or downregulated in VA-RCAZ..
Notes: (A) Principal component analysis of VA-S and VA-RCAZ. Each dot represents the technologic replicate analysis of samples in the plot. (B) S-plot generates from orthogonal partial least-square discriminant analysis. Predictive component p[1] and correlation p(corr)[1] differentiate VA-S and VA-RCAZ. Each dot represents metabolites and candidate biomarkers are highlighted in red dot. (C) Candidate biomarkers by predictive component p[1], p(corr)[1], and enriched pathways. Results (C) are displayed as mean ± SEM, and significant differences are identified as determined by Student’s t-test. **P<0.01. At least three biologic repeats were carried out.
Abbreviations: VA-RCAZ, ceftazidime-resistant Vibrio alginolyticus; VA-S, ceftazidime-sensitive Vibrio alginolyticus.
![Figure 4 Metabolites up- or downregulated in VA-RCAZ..Notes: (A) Principal component analysis of VA-S and VA-RCAZ. Each dot represents the technologic replicate analysis of samples in the plot. (B) S-plot generates from orthogonal partial least-square discriminant analysis. Predictive component p[1] and correlation p(corr)[1] differentiate VA-S and VA-RCAZ. Each dot represents metabolites and candidate biomarkers are highlighted in red dot. (C) Candidate biomarkers by predictive component p[1], p(corr)[1], and enriched pathways. Results (C) are displayed as mean ± SEM, and significant differences are identified as determined by Student’s t-test. **P<0.01. At least three biologic repeats were carried out.Abbreviations: VA-RCAZ, ceftazidime-resistant Vibrio alginolyticus; VA-S, ceftazidime-sensitive Vibrio alginolyticus.](/cms/asset/28c87964-ebbc-421d-bac2-82cb1d28bebe/didr_a_179639_f0004_c.jpg)
Figure 5 P cycle and energy metabolism in VA-RCAZ.
Notes: (A) Abundance of five metabolites in the P cycle. (B) Flux of the P cycle and biosynthesis of fatty acids in VA-RCAZ compared with VA-S. (C) Activity of enzymes (PDH, CS, IDH, OGDH, SDH, MDH, and ICL) in the P cycle. Overnight VA-S and VA-RCAZ were diluted to 1:100 using fresh 3% NaCl LB medium and grown at 30°C for 3 hours. (D) Interactive Pathways Explorer (iPath) analysis. Metabolic network pathways in VA-RCAZ were analyzed with iPath 2.0 (http://pathways2.embl.de/iPath2.cgi#). Analyses of the 42 differential metabolites (the other metabolites are not recognized in the metabolic network pathways). Red: increase; blue: decrease. (E) Percent survival of VA-S in the presence or absence of inhibitors (furfural and malonate). Overnight VA-S were incubated with CAZ (5 μg/mL) plus furfural (5, 20, and 80 μM) or malonate (5, 10, and 20 mM) in M9 minimal medium plus NaAc (10 mM) at 30°C for 6 hours. (F) Enzyme activity of PDH and SDH in the presence or absence of inhibitors (furfural and malonate). Overnight VA-S were incubated with furfural (80 μM) or malonate (20 mM) in M9 minimal medium plus NaAc (10 mM) at 30°C for 6 hours. Results (A, C, E, and F) are displayed as mean ± SEM, and significant differences are identified as determined by Student’s t-test. *P<0.05, **P<0.01. At least three biologic repeats were carried out.
Abbreviations: CAZ, ceftazidime; ICL, isocitrate lyase; IDH, isocitrate dehydrogenase; MDH, malate dehydrogenase; P cycle, pyruvate cycle; PDH, pyruvate dehydrogenase; SDH, succinate dehydrogenase; TCA, tricarboxylic acid; VA-RCAZ, ceftazidime-resistant Vibrio alginolyticus; VA-S, ceftazidime-sensitive Vibrio alginolyticus.
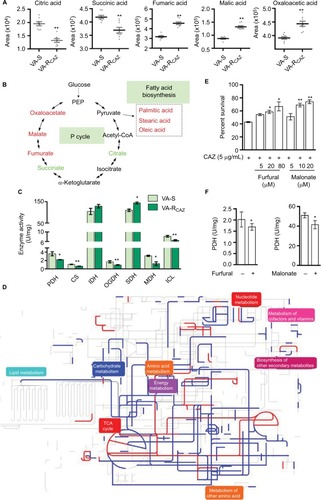
Figure 6 Nqr complex and PMF.
Notes: (A) Membrane potential of VA-S and VA-RCAZ. Overnight VA-S and VA-RCAZ were diluted to 1:100 using fresh 3% NaCl LB medium and grown at 30°C for 3 hours, and then 106 CFU/mL cells were stained with 30 μM DiOC2(3) at 30°C for 30 minutes prior to flow cytometry assay. (B) Percent survival of VA-S in the presence of the indicated GEN. Overnight VA-S and VA-RCAZ were incubated with gentamicin (6.25, 12.5 μg/mL) in M9 minimal medium plus NaAc (10 mM) at 30°C for 6 hours. (C) Membrane potential of ATCC33787, nqrA-deleted, and nqrF-deleted mutants. Overnight ATCC33787, ΔnqrA, and ΔnqrF were diluted to 1:100 using fresh 3% NaCl LB medium and grown at 30°C for 3 hours, and then 106 CFU/mL cells were stained with 30 μM DiOC2(3) at 30°C for 30 minutes prior to flow cytometry analysis. (D) Percent survival of ATCC33787, nqrA-deleted, and nqrF-deleted mutants in the presence of the indicated CAZ. Overnight ATCC33787, ΔnqrA, and ΔnqrF were incubated with CAZ (0, 15, 20 μg/mL) in M9 minimal medium plus NaAc (10 mM) at 30°C for 6 hours. (E) Percent survival of VA-S in the presence of CAZ with the indicated NaN3 or CCCP. Overnight VA-S were incubated with CAZ (5 μg/mL) plus NaN3 (0.08, 0.4, and 2 mM) or CCCP (1.25, 2.5, and 5 μM) in M9 minimal medium plus NaAc (10 mM) at 30°C for 6 hours. Results are displayed as mean ± SEM, and significant differences are identified as determined by Student’s t-test. *P<0.05, **P<0.01. At least three biologic repeats were carried out.
Abbreviations: CAZ, ceftazidime; CFU, colony-forming unit; GEN, gentamicin; LB, Luria–Bertani; PMF, proton motive force; VA-RCAZ, ceftazidime-resistant Vibrio alginolyticus; VA-S, ceftazidime-sensitive Vibrio alginolyticus; WT, wild type.
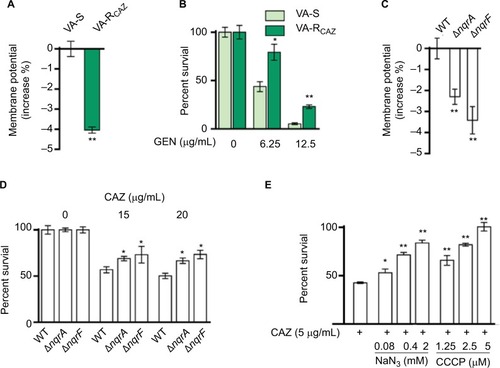
Figure 7 Fatty acid metabolism and resistance to CAZ.
Notes: (A) Percent survival of VA-RCAZ in the presence of the indicated triclosan plus CAZ. Overnight VA-RCAZ were incubated with CAZ (1.5 μg/mL) plus triclosan (2.5, 5 μg/mL) in M9 minimal medium plus NaAc (10 mM) at 30°C for 6 hours. (B) Percent survival of VA-S incubated in LB medium with exogenous palmitate or stearate, and then in M9 medium with CAZ (1.5 μg/mL). Overnight VA-S, cultured in LB with 0.2 mM of palmitate or stearate, were incubated with CAZ (1.25 μg/mL) in M9 minimal medium plus NaAc (10 mM) for 6 hours. (C) Quantitative real-time PCR for expression of genes in fatty acid metabolism. Overnight VA-S and VA-RCAZ were diluted to 1:100 using fresh 3% NaCl LB medium and grown at 30°C for 3 hours. (D) Outline for expression of genes in fatty acid metabolism pathway. Red: increase, green: decrease. Results (A–C) are displayed as mean ± SEM, and significant differences are identified as determined by Student’s t-test. *P<0.05, **P<0.01. At least three biologic repeats were carried out.
Abbreviations: CAZ, ceftazidime; LB, Luria–Bertani; VA-RCAZ, ceftazidime-resistant Vibrio alginolyticus; VA-S, ceftazidime-sensitive Vibrio alginolyticus.
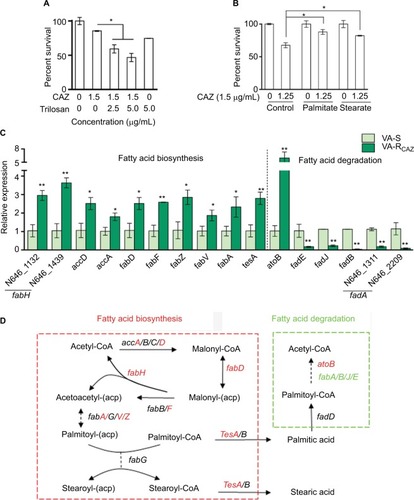
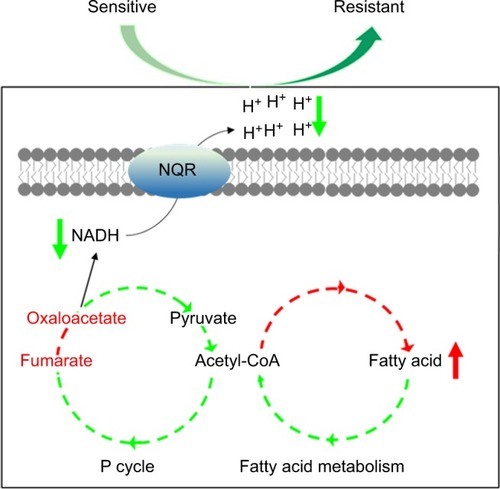
Figure 8 Model for resistance to ceftazidime in Vibrio alginolyticus.
Abbreviations: NADH, nicotinamide adenine dinucleotide; P cycle, pyruvate cycle.