Figures & data
Figure 1 Treatment protocols for the five disruptions.
Notes: a: 30-minute exposure to chlorhexidine. b: 3-minute rinsing procedure.
Abbreviations: d, day; RIF, rifampicin; temp, temperature; TET, tetracycline.
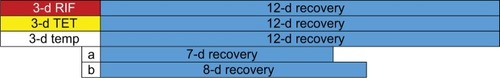
Table 1 Community susceptibility after rinsing treatment
Figure 2 Sensitive and resistant culturable numbers.
Notes: (A) Data from the PT fish shown at −1 on the X-axis. Data from the fish after 3 days of RIF treatment shown at 0 on the X-axis. All other points shown at days after recovery. PT resistant count is 0. All five graphs share the same axes for ease of comparison. (B) Data from the PT fish shown at −1 on the X-axis. Data from the fish after 3 days of TET treatment shown at 0 on the X-axis. All other points shown at days after recovery. There were no TET-resistant colonies from PT fish or at the 1 day time point for the control fish. (C) Data from the PT fish shown at −1 on the X-axis. Counts after 30-minute CHX treatment shown at 0 on the X-axis. All other points shown at days after recovery. (D) Data from the PT fish shown at −1 on the X-axis. Data at 10 hours, just after final temperature reached, shown at −0.5 on the X-axis. Data from the fish after 3 days of 34°C treatment shown at 0 on the X-axis. All other points shown at days after recovery. (E) Data from the PT fish shown at 0 on the X-axis. All other points shown at days after recovery. This first time point is after 10 hours of recovery.
Abbreviations: CFU, colony-forming unit; CHX, chlorhexidine; PT, pre-treatment; RIF, rifampicin; TET, tetracycline; treat, treatment.
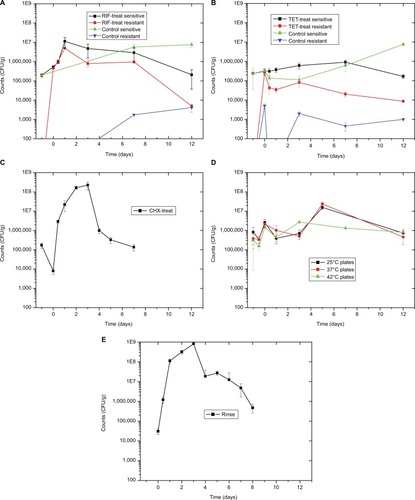
Table 2 Skin mucin levels after rinsing
Table 3 Skin Gram stain after rinsing
Table 4 Skin microbiome metabolic activity after rinsing
Figure 3 Community composition rinse experiment.
Notes: Normalized abundance of community members at most precise level of taxonomic identification (mostly genus). OTUs that are identified at the family level have a single asterisk, ones identified at the order level have two asterisks, and class level with three asterisks. Names without an asterisk are at the genus level. Only shown are members with >1% abundance in at least one sample. The pre-treatment fish skin microbiome is an average abundance from three fish. All other columns represent one fish.
Abbreviation: OTU, operational taxonomic unit.
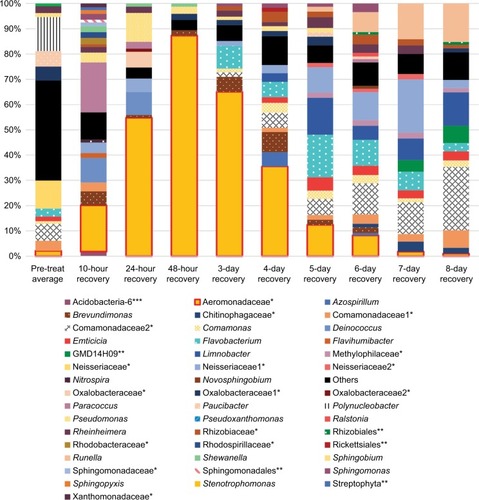
Table 5 Biochemical community profiles after RIF treatment
Table 6 Biochemical community profiles after TET treatment
Table 7 Biochemical community profiles after CHX treatment
Table 8 Biochemical community profiles after temperature treatment
Table 9 Biochemical community profiles after rinsing
Figure 4 Community fingerprint during and following elevated temperature.
Notes: Community fingerprint before, during, and after exposure of the fish skin microbiome to elevated temperatures. A: 100 bp DNA ladder, B: pre-treatment fish skin microbiome sample, C: pre-treatment aquarium water sample, D: 10-hour treatment, E: 10-hour treatment APW water sample, F: 3-day treatment, G: 3-day treatment APW sample, H: 24-hour recovery, I: 3-day recovery, J: 3-day recovery APW sample, K: 7-day recovery, L: 7-day recovery APW sample, M: 12-day recovery, N: empty lane, and O: 1 kb DNA ladder. Lanes with arrows are fish skin microbiome, other lanes are surrounding water samples.
Abbreviation: APW, artificial pond water.
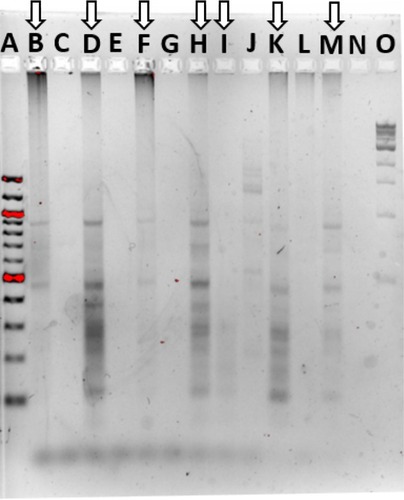
Figure 5 Community fingerprint during rinse experiment.
Notes: (A) RISA pattern from physical rinse disruption experiment. A: 100 bp DNA ladder, B: pre-treatment fish skin microbiome sample, C: 5-hour recovery, D: 10-hour recovery, E: 24-hour recovery, F: 48-hour recovery, G: 4-day recovery, H: 7-day recovery, and I: 1 kb DNA ladder. (B) ERIC PCR pattern from physical rinse disruption experiment. A: 1 kb DNA ladder, B: pre-treatment fish skin microbiome sample, C: 10-hour recovery, D: 1-day recovery, E: 2-day recovery, F: 4-day recovery, G: 5-hour recovery, H: 7-day recovery, and I: 1 kb DNA ladder.
Abbreviations: ERIC, enterobacterial repetitive intergenic consensus; RISA, ribosomal intergenic spacer analysis.
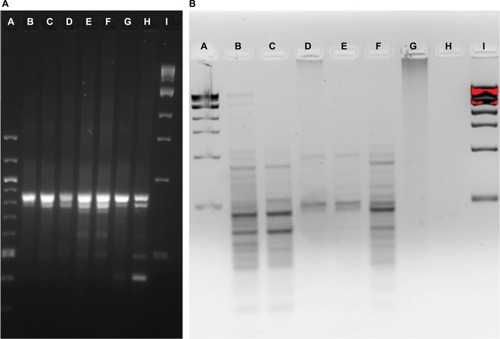
Table 10 Community susceptibility after CHX treatment
Table 11 Skin microbiome metabolic activity after rinsing
Table 12 Diversity of dominant community members
Figure 6 Venn diagrams comparing community compositions during rinse recovery (A–C).
Notes: Numbers represent bacterial families. PT is pre-treatment community. Other communities are days of recovery.
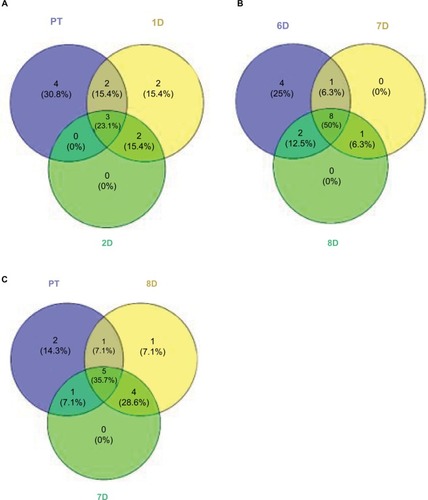
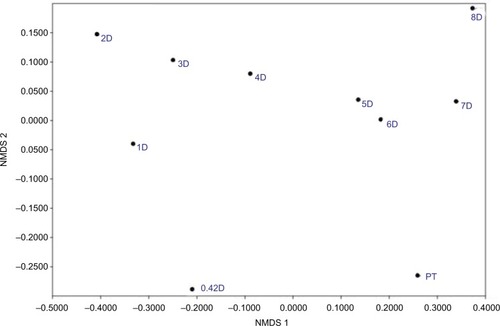
Figure 7 NMDS comparing community compositions during rinse recovery.
Notes: NMDS is non-metric multidimensional scaling, performed by the PAST program, version 3.21.Citation33 PT is pre-treatment, and all communities represented by a number with D are days of recovery.