Figures & data
Table 1 Components of the four co-culture groups
Table 2 Primers used in the study
Figure 1 Incubation of HaCaT cells with increasing starting concentrations of Staphylococcus aureus led to a dose-dependent decline of the cell proliferation.
Notes: Significant deviations from the HaCaT control at the respective incubation time (*P<0.05; **P<0.01).
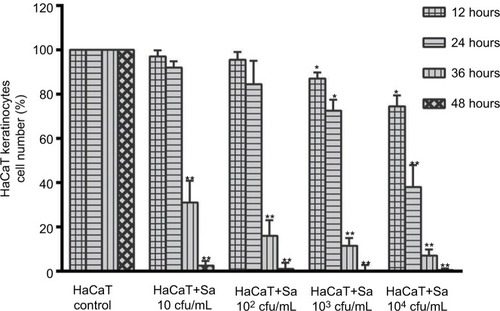
Figure 2 Comparison of antibacterial activity between PRG and EPG and antibacterial performance of EPG at different concentrations.
Notes: (A) Comparison of the effects of PRG and EPG on the growth of S. aureus. (B) Effects of different concentrations of EPG on the growth of extracellular S. aureus. (C) Effects of different concentrations of EPG on the growth of intracellular S. aureus. Viable bacteria were quantified by the colony plate counting method. Significant deviations from the 30% PPP group (*P<0.05; **P<0.01).
Abbreviations: EPG, extract liquid of platelet-rich gel; PPP, Platelet-poor plasma; PRG, platelet-rich gel; S. aureus, Staphylococcus aureus.
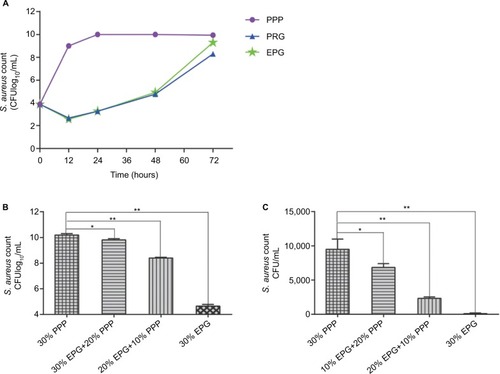
Figure 3 Amounts of 10% and 20% EPG were tested for their capacity to protect HaCaT cells from bacterial damage and promote HaCaT cells proliferation.
Notes: Significant deviations from the HaCaT control at the respective incubation time (*P<0.05; **P<0.01).
Abbreviation: EPG, extract liquid of platelet-rich gel.
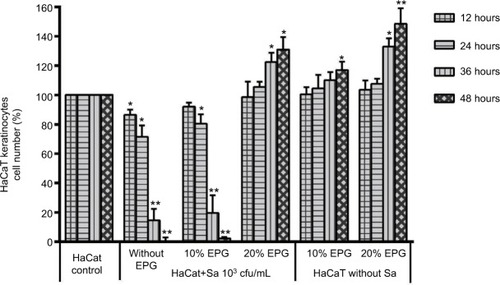
Figure 4 Images of the four groups under light microscope.
Notes: Photos were taken before extraction of RNA from HaCaT cells at various time points. Scale bar: 100 µm.
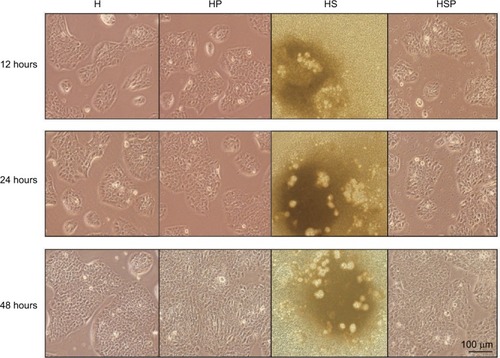
Figure 5 miR-21, PDCD4 and phospho-NF-κB p65 (P-P65) level in HaCaT cells of the four groups.
Notes: PDCD4 and p-p65 increased because of bacterial infection but decreased by EPG at the 12th and 24th hour. Direct application of EPG to HaCaT cells down-regulated PDCD4 and p-p65 protein at the 24th and 48th hour. MiR-21 elevated with reduced PDCD4 and p-p65 at the 24th and 48th hour. In the setting of bacterial infection, results at the 48th hour are not shown because of insufficient RNA and protein extracted from the residual cells. Significant deviations from the HaCaT control at the respective incubation time (*P<0.05; **P<0.01).
Abbreviations: EPG, extract liquid of platelet-rich gel; PDCD4, programmed cell death factor 4.
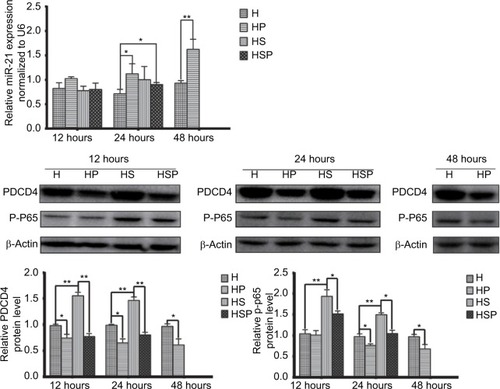
Figure 6 Immunofluorescence microscopy analysis of the spatial localization of the NF-κB p65 protein.
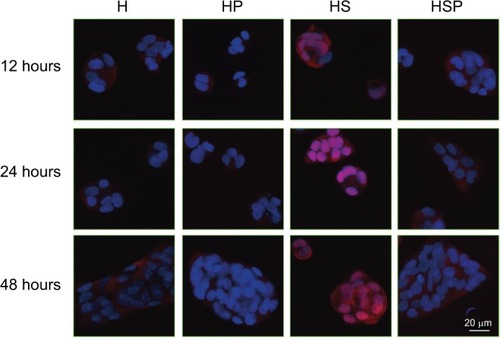
Figure 7 (A) IL-6, (B) IL-10, (C) TNF-α, (D) TGF-β1 mRNA expression in HaCaT cells as measured by qRT-PCR.
Notes: In the setting of bacterial infection, results at the 48th hour are not shown because of insufficient RNA extracted from residual cells. Significant deviations from the HaCaT control at the respective incubation time (*P<0.05; **P<0.01).
Abbreviations: EPG, extract liquid of platelet-rich gel; qRT-PCR, quantitative reverse transcription; TNF-α, tumor-necrosis factor alpha.
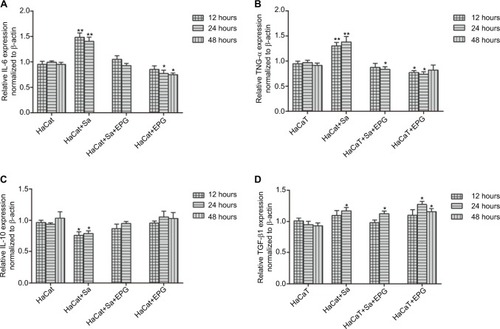
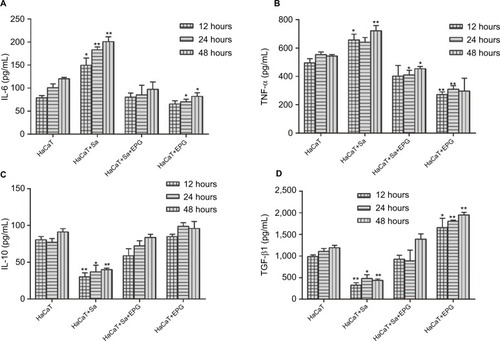
Figure 8 (A) IL-6, (B) IL-10, (C) TNF-α, (D) TGF-β1 content in the supernatant as determined by ELISA.
Notes: Significant deviations from the HaCaT control at the respective incubation time (*P<0.05; **P<0.01).
Abbreviations: EPG, extract liquid of platelet-rich gel; TNF-α, tumor-necrosis factor alpha.