Figures & data
Table 1 In vitro susceptibilities of azithromycin and clarithromycin against selected pathogens
Table 2 Pharmacokinetics of clarithromycin and azithromycin in plasma. (Derived from data published in references.Citation75–Citation78,Citation80)
Figure 1 Differential effects of randomized, open-label macrolide assignment on the prevalence of macrolide-resistant strains in the oral flora of children.
Notes: One week after treatment, ~90% of patients treated with azithromycin, clarithromycin, erythromycin, roxithromycin, or josamycin harbored resistant strains. By 6 weeks posttreatment, the percentage of resistant organisms had decreased to 17% for clarithromycin but for azithromycin the prevalence of resistant organisms remained very high (85%) and was associated with a substantial re-infection rate (11.6%). (Derived from data published in reference.Citation82)
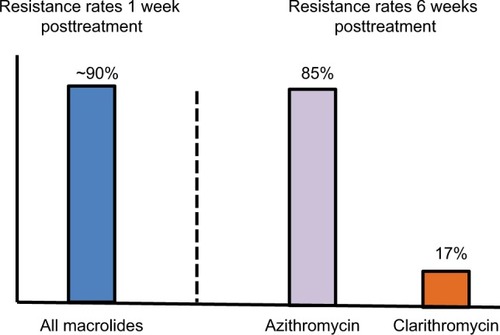
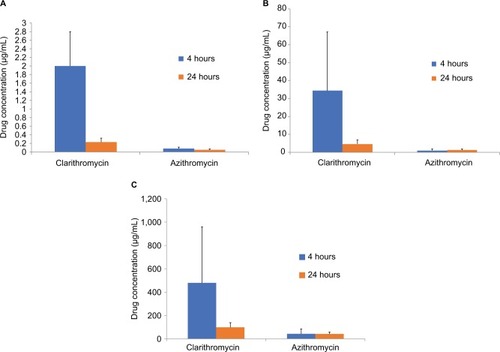
Figure 2 Comparison of achieved concentrations of azithromycin (500 mg on day 1 then 250 mg/day for 4 days) and clarithromycin (500 mg twice daily for 9 days) in (A) plasma, (B) epithelial lining fluid (ELF), and (C) alveolar macrophages of healthy adult volunteers at 4 and 24 hours after last drug administration.
Notes: All comparisons P<0.05 vs azithromycin except ELF at 24 hours. The mean ratio of clarithromycin to 14-HC in plasma was 4.7:1 at 4 hours and decreased to 1.2:1 at 24 hours (data not shown). (Derived from data published in reference.Citation77)