
Figures & data
Table 1 Primer sequence used in the genetic characterization of Pseudomonas aeruginosa clinical strains
Table 2 Antibiotic resistance patterns in Pseudomonas aeruginosa isolates
Figure 1 Detection of pils2 gene (428 bp) in Pseudomonas aeruginosa isolates.
Notes: 1–3 and 5 positive samples, 4 and 6 negative samples; molecular pattern: 100 bp.
Abbreviations: N, negative control; P, positive control.
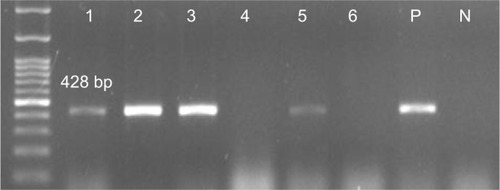
Figure 2 Detection of CP44 gene (272 bp) in Pseudomonas aeruginosa isolates.
Note: Molecular pattern: 100 bp.
Abbreviations: N, negative control; P, positive control.
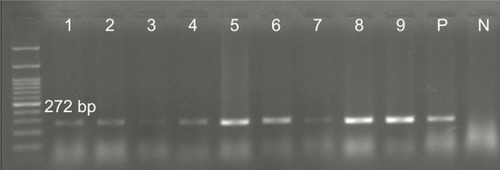
Figure 3 Detection of CP10 gene (255 bp) in Pseudomonas aeruginosa isolates.
Note: Molecular pattern: 100 bp.
Abbreviations: N, negative control; P, positive control.
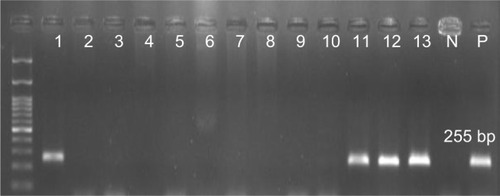
Table 3 Frequency of the specific genes CP10, CP44, and CP97 of pKLC102
Table 4 The association of pilS2 with pKLC102, chromosomal PAPI-1, and plasmid PAPI-1
Table 5 The association of pKLC102 with chromosomal PAPI-1 and plasmid PAPI-1