Figures & data
Figure 1 PRISMA 2009 flow diagram depicting identification and selection process (inclusion/exclusion) of the relevant published articles dealing with MBL2 gene polymorphisms and pulmonary tuberculosis risk for the present meta-analysis.
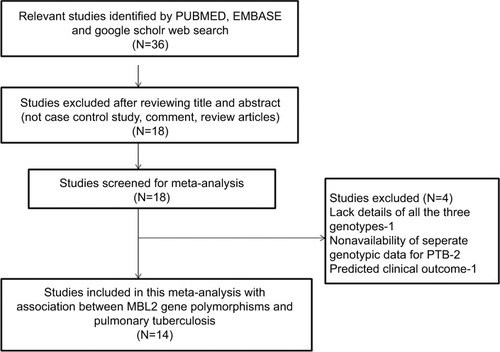
Table 1 Main characteristics of all the studies included in this meta-analysis
Table 2 Genotypic distribution of MBL2 gene polymorphism included in meta-analysis: first
Table 3 Genotypic distribution of MBL2 gene polymorphisms included in this meta-analysis: second
Table 4 Quality assessment conducted according to the NOS for all the included studies
Table 5 Statistics to test the publication bias and heterogeneity (rs1800450 Overall)
Figure 2 Forest plot of ORs with 95% CI of PTB risk associated with the MBL2 rs1800450 (A>B) gene polymorphism for the overall population.
Notes: Black squares represent the value of OR and the size of the square indicates the inverse proportion relative to its variance. Horizontal lines represent the 95% CI of OR.
Abbreviation: PTB, pulmonary tuberculosis.
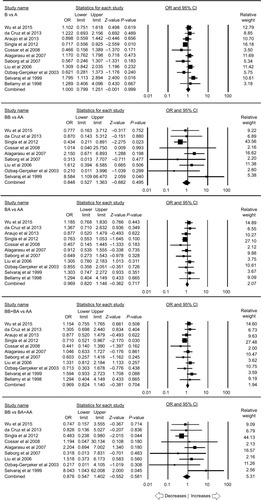
Table 6 Statistics to test the publication bias and heterogeneity (rs1800450 Asian)
Figure 3 Forest plot of ORs with 95% CI of PTB risk associated with the MBL2 rs1800450 (A>B) gene polymorphism for the Asian population.
Notes: Black squares represent the value of OR and the size of the square indicates the inverse proportion relative to its variance. Horizontal lines represent the 95% CI of OR.
Abbreviation: PTB, pulmonary tuberculosis.
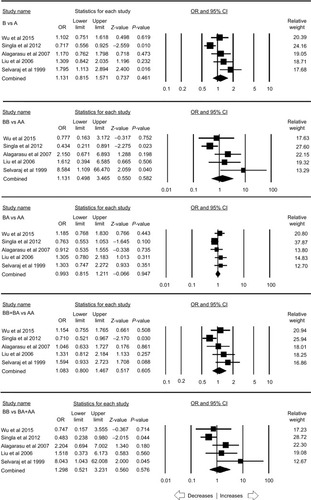
Table 7 Statistics to test the publication bias and heterogeneity (rs1800451 overall)
Figure 4 Forest plot of ORs with 95% CI of PTB risk associated with the rs1800451 (A>C) gene polymorphism for the overall population.
Notes: Black squares represent the value of OR and the size of the square indicates the inverse proportion relative to its variance. Horizontal lines represent the 95% CI of OR.
Abbreviation: PTB, pulmonary tuberculosis.
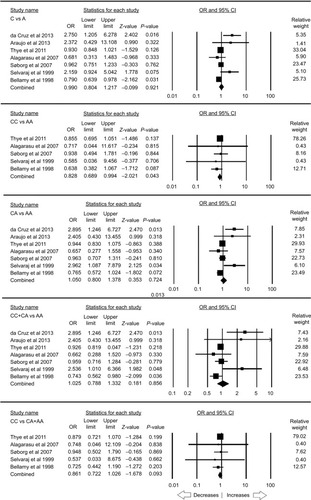
Table 8 Statistics to test the publication bias and heterogeneity (rs1800451 African)
Figure 5 Forest plot of ORs with 95% CI of PTB risk associated with the rs1800451 (A>C) gene polymorphism for the African population.
Notes: Black squares represent the value of OR and the size of the square indicates the inverse proportion relative to its variance. Horizontal lines represent the 95% CI of OR.
Abbreviation: PTB, pulmonary tuberculosis.
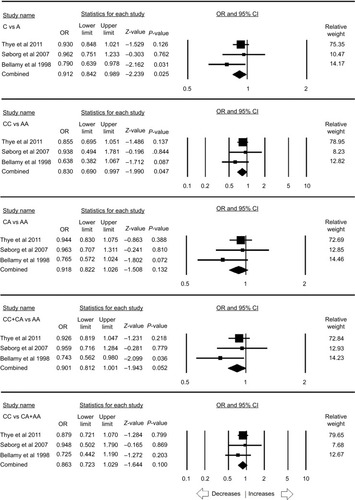
Table 9 Statistics to test the publication bias and heterogeneity (rs5030737 overall)
Figure 6 Forest plot of ORs with 95% CI of PTB risk associated with the rs5030737 (A>D) gene polymorphism for the overall population.
Notes: Black squares represent the value of OR and the size of the square indicates the inverse proportion relative to its variance. Horizontal lines represent the 95% CI of OR.
Abbreviation: PTB, pulmonary tuberculosis.
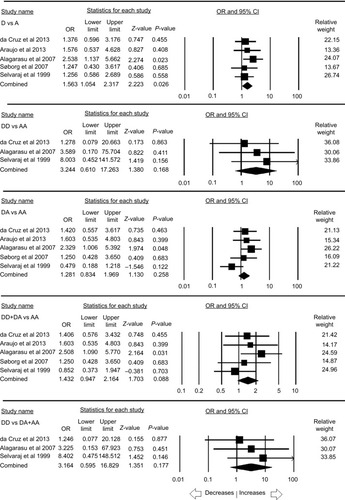
Table 10 Statistics to test the publication bias and heterogeneity (combined overall)
Figure 7 Forest plot of ORs with 95% CI of PTB risk associated with MBL2 combined rs1800450, rs1800451, rs5030737 (A>O) gene polymorphism for the overall population.
Notes: Black squares represent the value of OR and the size of the square indicates the inverse proportion relative to its variance. Horizontal lines represent the 95% CI of OR.
Abbreviation: PTB, pulmonary tuberculosis.
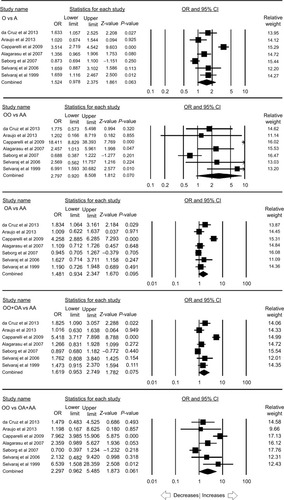
Table 11 Statistics to test the publication bias and heterogeneity (combined Asian)
Figure 8 Forest plot of ORs with 95% CI of PTB risk associated with MBL2 combined rs1800450, rs1800451, rs5030737 (A>O) gene polymorphism for the Asian population.
Notes: Black squares represent the value of OR and the size of the square indicates the inverse proportion relative to its variance. Horizontal lines represent the 95% CI of OR.
Abbreviation: PTB, pulmonary tuberculosis.
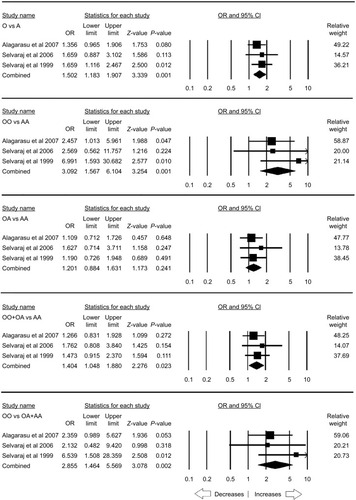
Table 12 Statistics to test the publication bias and heterogeneity (rs7096206 overall)
Figure 9 Forest plot of ORs with 95% CI of PTB risk associated with MBL2 rs7096206 (Y>X) gene polymorphism for the overall population.
Notes: Black squares represent the value of OR and the size of the square indicates the inverse proportion relative to its variance. Horizontal lines represent the 95% CI of OR.
Abbreviation: PTB, pulmonary tuberculosis.
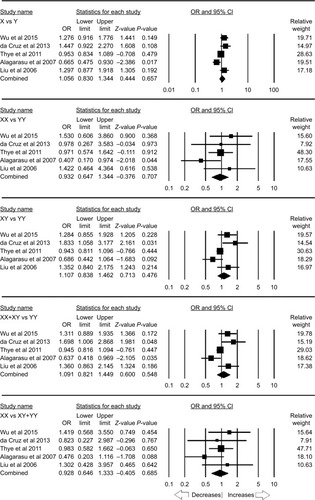
Table 13 Statistics to test the publication bias and heterogeneity (rs7096206 Asian)
Figure 10 Forest plot of ORs with 95% CI of PTB risk associated with MBL2 rs7096206 (Y>X) gene polymorphism for the Asian population.
Notes: Black squares represent the value of OR and the size of the square indicates the inverse proportion relative to its variance. Horizontal lines represent the 95% CI of OR.
Abbreviation: PTB, pulmonary tuberculosis.
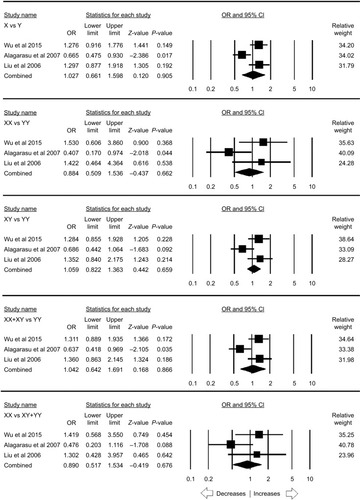
Table 14 Statistics to test the publication bias and heterogeneity (rs11003125 overall)
Figure 11 Forest plot of ORs with 95% CI of PTB risk associated with MBL2 rs11003125 (H>L) gene polymorphism for the overall population.
Notes: Black squares represent the value of OR and the size of the square indicates the inverse proportion relative to its variance. Horizontal lines represent the 95% CI of OR.
Abbreviation: PTB, pulmonary tuberculosis.
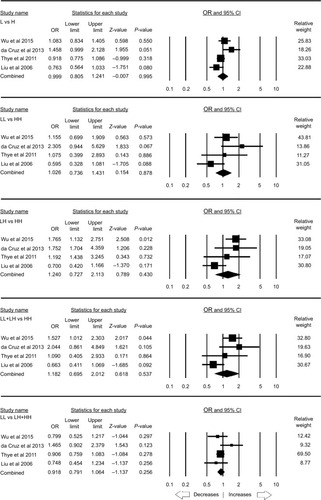
Table 15 Summary of the results of association of MBL2 gene polymorphisms and PTB risk (overall and ethnicity-wise analysis)
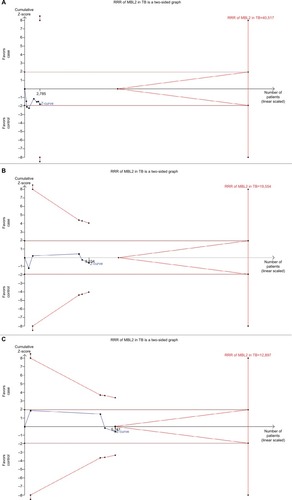
Figure 12 Trial sequence analysis of all the included studies dealing with MBL2 gene polymorphisms, based on dominant genetic model, and PTB risk: (A) rs1800450 (A>B), (B) rs1800451 (A>C), and (C) rs5030737 (A>D).
Abbreviations: PTB, pulmonary tuberculosis; RRR, relative risk reduction.
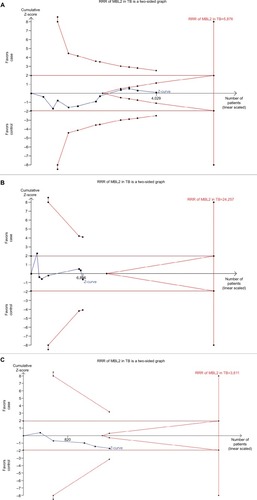
Figure 13 Trial sequence analysis of all the included studies dealing with MBL2 gene polymorphisms, based on dominant genetic model, and PTB risk: (A) combined rs1800450, rs1800451, rs5030737 (A>O), (B) rs7096206 (Y>X), and (C) rs11003125 (H>L).
Abbreviation: PTB, pulmonary tuberculosis.