Figures & data
Table 1 Characteristics of included studies
Figure 1 Flow diagram of the study selection process.
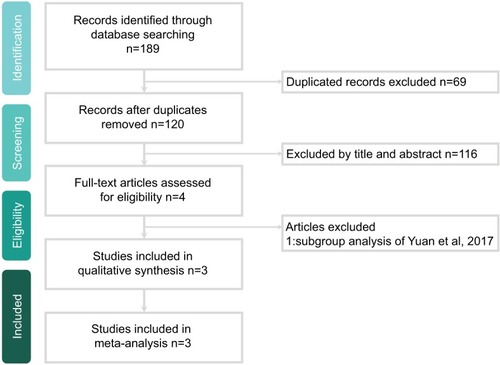
Figure 2 Summary of risk of bias.
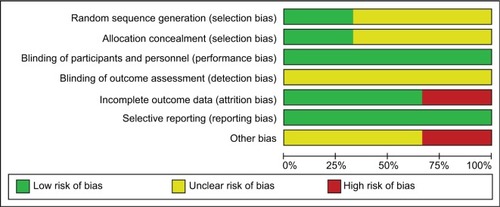
Figure 3 Risk of bias per study and domain.
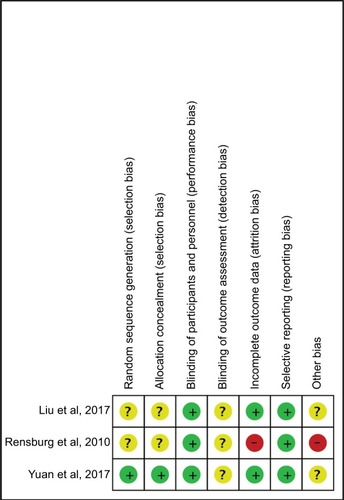
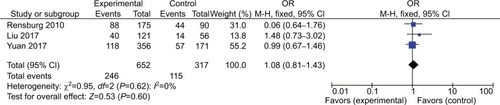
Figure 4 The overall clinical cure rates of nemonoxacin and levofloxacin in the treatment of community-acquired pneumonia.
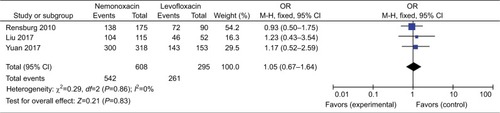
Figure 5 The overall microbiologic response rates of nemonoxacin and levofloxacin in the treatment of community-acquired pneumonia.
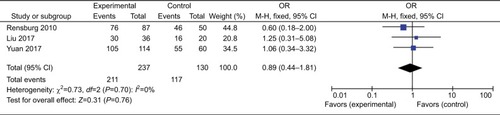
Figure 6 The overall risks of treatment-emergent adverse events for nemonoxacin and levofloxacin in the treatment of community-acquired pneumonia.