
Figures & data
Table 1 Variations in individual pathogens’ load on hospital surfaces during pre-PCHS and PCHS (CFU/m2)
Figure 1 Resistome analysis of the hospital surface microbiota.
Notes: The resistome of the surface contaminant population was analyzed as described in the “Patients and methods” section. The results of the pre-intervention (pre-PCHS, left panels) and intervention (PCHS, right panels) phases are shown for each setting (hospitals 1, 2, 3, 4, and 5). The results of the pre-PCHS phase are expressed as the log10 fold change of each detected R gene compared with the negative controls (NTC), and the results of the PCHS phase are expressed as the log10 fold change of each detected R gene compared with the pre-PCHS phase. The plotted data are the mean values obtained in monthly environmental sampling campaigns (12 sampling campaigns) for all of the sampled points (18 sampled points per hospital per sampling campaign).
Abbreviation: PCHS, Probiotic Cleaning Hygiene System.
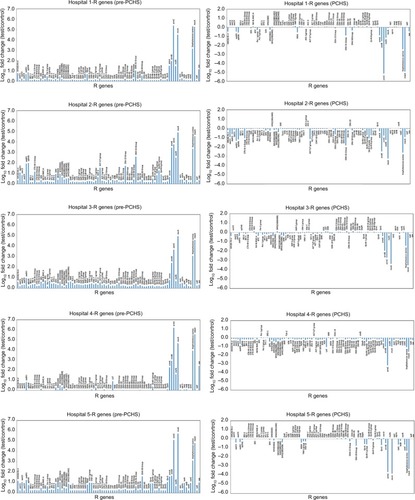
Figure 2 Resistome analysis of the hospital surface microbiota during the pre-PCHS phase.
Notes: The resistome of the surface contaminant population was analyzed as described in the “Patients and methods” section. The results of the pre-intervention (pre-PCHS) phase are plotted according to the prevalence of R genes. The results are the mean values for all five enrolled hospitals obtained in monthly environmental sampling campaigns (six sampling campaigns) for all of the sampled points (18 sampled points per hospital per sampling campaign).
Abbreviations: PCHS, Probiotic Cleaning Hygiene System; CTR, control.
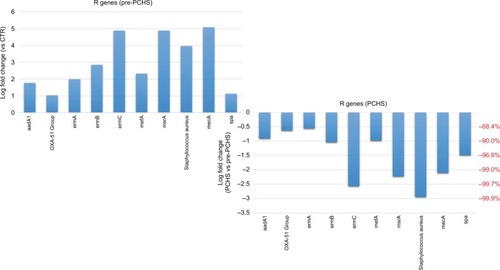
Table 2 Antibiotic resistance in Staphylococcus aureus isolates of pre-PCHS and PCHS phases of the study
Table 3 Drug consumption and therapy days during pre-PCHS and PCHS phases of the survey
Table S1 Demographic characteristics of patients