
Figures & data
Figure 1 Phylogenetic tree of the entire sequences, including reference from accepted genotypesCitation2 (shown in different colors) and our sequence (Px). Trees were generated using neighbor-joining based on the p-distances. Only those bootstrap-values greater than 60 are shown.
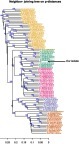
Figure 2 Phylogenetic tree of entire genomes from all 13 subtypes of genotype 1, and including 8 unassigned isolates (green) and our Px sequence (orange). The tree was generated using neighbor-joining based on p-distances. Only those bootstrap-values greater than 60 are shown.
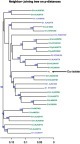
Figure 3 Heatmap visualizing the p-distances between all G1 reference sequences and the new isolate (Px). The scale on the right indicates the p-distance according to color, with red representing a short and blue a long p-distance. The clusters shown in light colors indicate the grouping of subtypes based on their similarity. The new isolate did not cluster with any subtype.
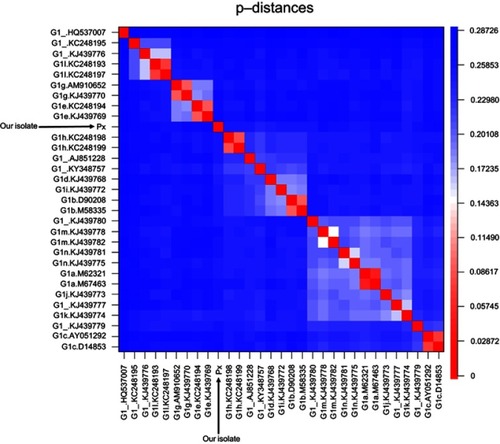
Figure 4 Visual representation of the sliding window analysis (500-bp, by 10-bp steps). The minimum p-distance between the new isolate (Px) and any reference sequence of accepted subtypes for each 500-bp window is shown in black. The green dotted line represents the minimum p-distance between the closest sequences belonging to the various subtypes. The blue dotted line indicates the average p-distance of all accepted G1 subtypes for each window. The red dotted line represents the maximum p-distance between the farthest sequences belonging to the accepted subtypes for each window.
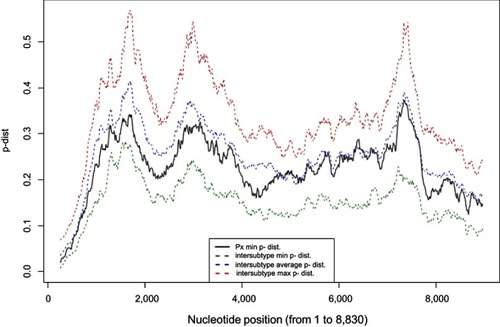
Table 1 Mean fold change in resistance compared with wild type, found in G1a and G1b (in brackets)Citation7,Citation8,Citation9,Citation18