Figures & data
Figure 1 The effect of 100 μM VOR on IMA metabolite (CGP74588) formation (A) and various concentrations (0, 0.01, 0.1, 1, 10, 50, 100, and 1,000 μM) of VOR for IC50 (B) in RLMs. Values are Mean ± SD, n=3.
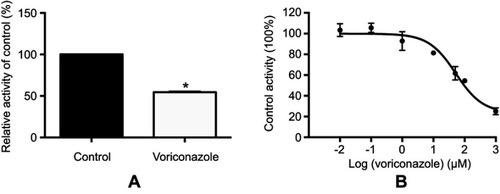
Figure 2 The effect of 100 μM IMA on VOR metabolite (N-oxide VOR) formation (A) and various concentrations (0, 0.01, 0.1, 1, 10, 20, 50, and 100 μM) of IMA for IC50 (B) in RLMs. Values are Mean ± SD, n=3. *P<0.05.
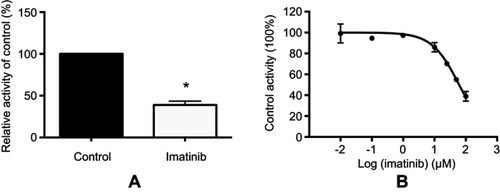
Table 1 Pharmacokinetic parameters of IMA, VOR, and their metabolites in three different groups (n=8)
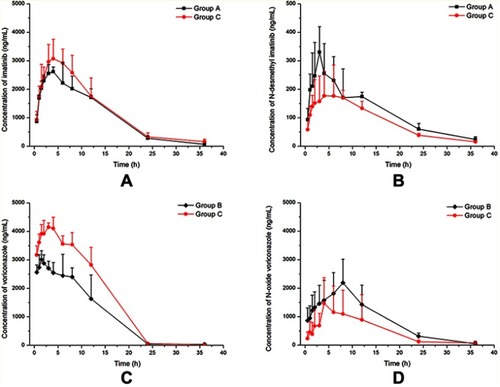
Figure 3 Mean plasma concentration versus time of IMA (A), CGP74588 (B), VOR (C), N-oxide VOR (D) in three group rats (Mean ± SD, n=8).