
Figures & data
Table 1 Primers used in this study
Table 2 Antibiotic susceptibility of strains in planktonic and biofilm mode
Figure 1 Biofilm formation by A. baumannii strains in the presence of sub-MICs of tigecycline and meropenem. Error bars represent the standard deviations; *significant difference at a P-value of 0.05. REF: A. baumannii 19606.
Abbreviations: A. baumannii, Acinetobacter baumannii; MIC, minimum inhibitory concentration; REF, reference srain.
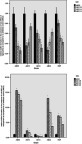
Figure 2 Effect of tigecycline at sub-MICs on the expression levels of the efflux pumps, pili regulation and biofilm involved genes in A. baumannii strains. Error bars represent the standard deviations; *significant difference at a P-value of 0.05.
Abbreviations: A. baumannii, Acinetobacter baumannii; MIC, minimum inhibitory concentration.
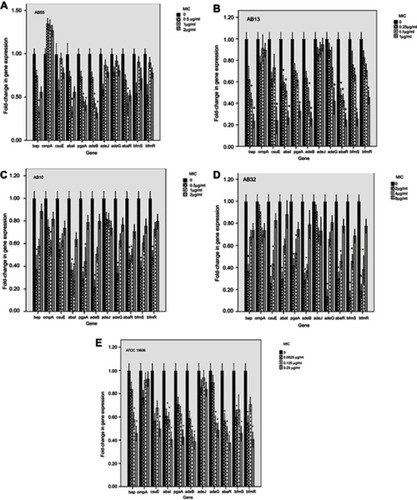
Figure 3 Effect of meropenem at sub-MICs on the expression levels of the efflux pumps, pili regulation and biofilm involved genes in A. baumannii strains. Error bars represent the standard deviations; *significant difference at a P-value of 0.05.
Abbreviations: A. baumannii, Acinetobacter baumannii; MIC, minimum inhibitory concentration.
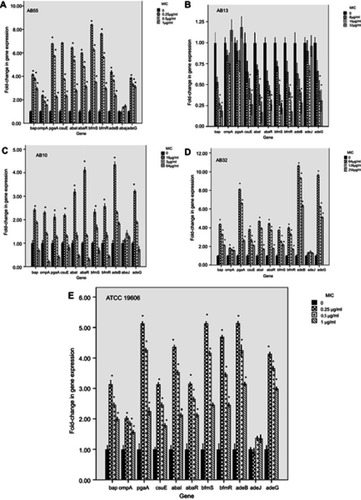
Table 3 Association between biofilm formation and the gene expression profiles of A. baumannii strains at sub-MICs of tigecycline
Table 4 Association between biofilm formation and the gene expression profiles of A. baumannii strains at sub-MICs of meropenem
Table 5 Association between Quorum sensing with the gene expression profiles of A. baumannii strains at sub-MICs of tigecycline
Table 6 Association between Quorum sensing and the gene expression profiles of A. baumannii strains at sub-MICs of meropenem