Figures & data
Table 1 Baseline characteristics of the participants in the four groups
Table 2 Radiological characteristics of the DS-TB and MDR-TB patients
Figure 1 Imaging signs of transvers CT scans from patients in the drug-sensitive tuberculosis (DS-TB) group and multidrug-resistant tuberculosis (MDR-TB) group. (A) Lung window of chest CT scan from a patient in the MDR-TB group in the present study, showing multiple large cavities (arrows), mainly in the left upper lobe, with lung volume loss. (B) Lung window of chest CT scan from another patient in the MDR-TB group in the present study, showing extensive cavitary lesions (arrows) evolved in the bilateral lungs. (C) Lung window of chest CT scan from a patient in the DS-TB group in the present study, showing at the level of the left basal trunk small nodules branching in the linear and lobular area of bronchiectasis (arrows), with a single cavity formation in the left lower lobe. (D) Lung window of chest CT scan from another patient in the DS-TB group in the present study, showing at the level of the aortic arch nodular opacities and consolidations (arrow), and the lobular area of infiltration lesions.
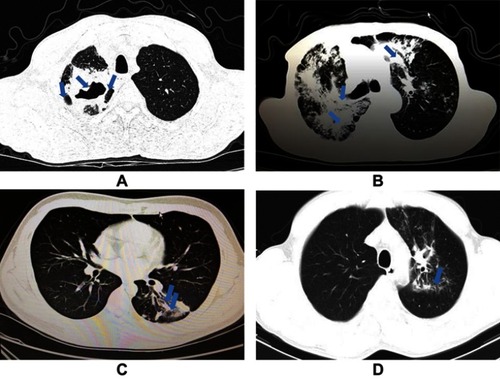
Figure 2 Boxlots of plasma concentrations of Kyn, Trp, and IDO activity in HCs and patients with DS-TB, MDR-TB, and LC. (A) The Kyn concentration in the MDR-TB group was higher than in the HC, DS-TB, and LC groups (MDR-TB vs HC, p=0.013; MDR-TB vs DS-TB, p=0.003; MDR-TB vs LC, p=0.022). Meanwhile, no significant difference was found between the HC and DS-TB groups (p=0.844). (B) The Trp concentration in the MDR-TB group was lower than in the HC, DS-TB, and LC groups (MDR-TB vs HC, p<0.0001; MDR-TB vs DS-TB, p<0.0001; MDR-TB vs LC, p=0.001). In addition, the Trp concentration in the DS-TB group was lower than in the HCs (p=0.044). (C) The IDO activity (Kyn/Trp ratio) in patients with MDR-TB was higher than in the HC, DS-TB, and LC groups (MDR-TB vs HC, p=0.003; MDR-TB vs DS-TB, p=0.012; MDR-TB vs LC, p=0.003). Meanwhile, no significant difference was found between the HC and DS-TB groups (p=0.687).
Abbreviations: Kyn, kynurenine; Trp, tryptophan; IDO, indoleamine 2,3-dioxygenase; HC, healthy control; DS-TB, drug-sensitive tuberculosis; MDR-TB, multidrug-resistant tuberculosis; LC, lung cancer.
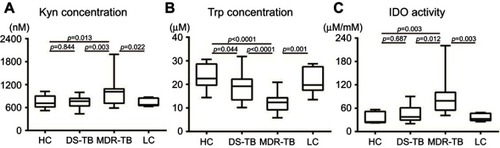
Table 3 Diagnostic significance of plasma concentrations of Kyn, Trp, and IDO activity for discriminating MDR-TB patients from TB patients
Figure 3 ROC curves of plasma concentrations of Kyn, Trp, and IDO activity for discriminating MDR-TB patients from DS-TB patients. (A) Using a cutoff of 857.5 nM, plasma Kyn concentration had a diagnostic sensitivity of 68.75% and a specificity of 88.89% (AUC =0.764). (B) The AUC was 0.833 for Trp concentration (cutoff value 17.58 µM/mM, sensitivity 93.75%, specificity 72.22%). (C) The AUC of IDO activity in differentiating patients with MDR-TB from DS-TB was 0.882, and the cutoff value was 46.58 µM/mM. Sensitivity and specificity were 87.50% and 72.22%, respectively.
Abbreviations: Kyn, kynurenine; Trp, tryptophan; IDO, indoleamine 2,3-dioxygenase; AUC, area under the curve; ROC, receiver operating characteristic; MDR-TB, multidrug-resistant tuberculosis; DS-TB, drug-sensitive tuberculosis.
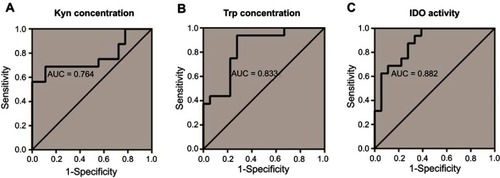
Table 4 Correlation coefficient between cavity number, maximum cavity diameter, sum of cavity diameters, and kynurenine, tryptophan, and IDO activity by patient group
Figure 4 Boxplots of plasma concentrations of Kyn, Trp, and IDO activity in non-cavitary and cavitary TB patients. (A) There was no difference in Kyn concentration between the two groups (p=0.296). (B) The Trp concentration in cavitary TB patients was lower than in non-cavitary TB patients (p=0.037). (C) The IDO activity in cavitary TB patients was higher than in non-cavitary TB patients (p=0.042).
Abbreviations: Kyn, kynurenine; Trp, tryptophan; IDO, indoleamine 2,3-dioxygenase; TB, tuberculosis.
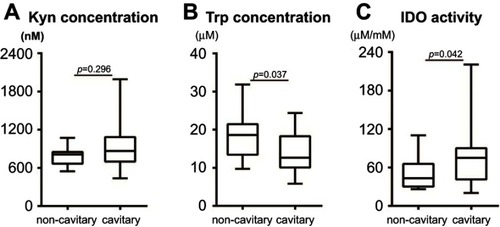
Table 5 Diagnostic significance of plasma concentrations of Kyn, Trp, and IDO activity for discriminating MDR-TB patients from the LC patients
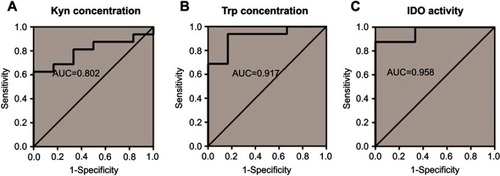
Figure 5 ROC curves of plasma concentrations of Kyn, Trp, and IDO activity for discriminating LC and MDR-TB patients. (A) The AUC of Kyn concentration was 0.802, with a sensitivity and specificity of 68.75% and 83.33%, respectively. (B) The sensitivity and specificity of the Trp concentration were found to be 93.75% and 83.33%, respectively, with an AUC of 0.917, and a cut-off value of 17.98 µM was obtained. (C) The sensitivity and specificity for plasma IDO activity were found to be 87.50% and 100.00%, respectively (AUC =0.958).
Abbreviations: Kyn, kynurenine; Trp, tryptophan; IDO, indoleamine 2,3-dioxygenase; MDR-TB, multidrug-resistant tuberculosis; DS-TB, drug-sensitive tuberculosis.