Figures & data
Table 1 Serotypes (O and H antigens), sequence types (STs), phylogenetic group assignations and antibiotic resistance phenotypes. The strains are grouped by their specific combination of serotype and ST
Table 2 Numbers and types of genes detected by Prokka and RAST
Figure 1 Occurrence of homologous gene families detected in the 24 UPEC strains. The number of homologous gene families ((y-axis) present in increasing numbers of strains (ranging from presence in at least 1 strain to all 24 strains) is shown. The numbers are displayed separately for the (A) Prokka and (B) RAST annotations. The genes of the cloud, shell, soft-core and core genome are indicated by color.
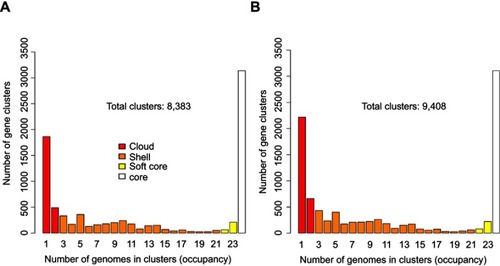
Figure 2 Hierarchical clustering of the strains by gene presence/absence with genes annotated by Prokka and RAST. The pangenome was used for clustering with (A) Prokka and (B) RAST. A distance tree was constructed based on the presence or absence of genes. Samples with a similar gene content clustered together.
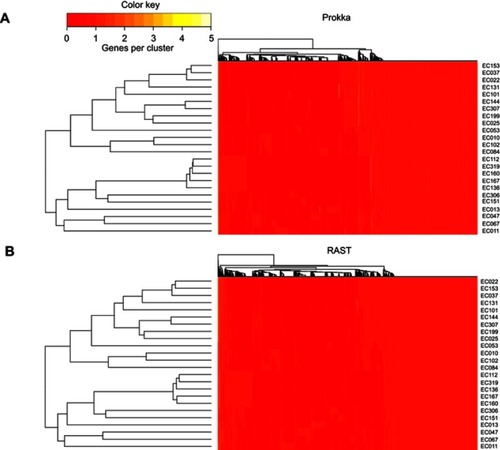
Figure 3 Average percentage of the contigs (of their genes) of each strain (column labels) that appears in one or more fragments with the same synteny in strain b (row labels). The values for all the comparisons between the 24 UPEC strains and the model strains CFT073 and EC958 ST-131 are shown. The strains were hierarchically clustered according to these values. The phylogroups and serotypes of the strains are indicated at the heatmap margins and in the row and column labels, respectively.
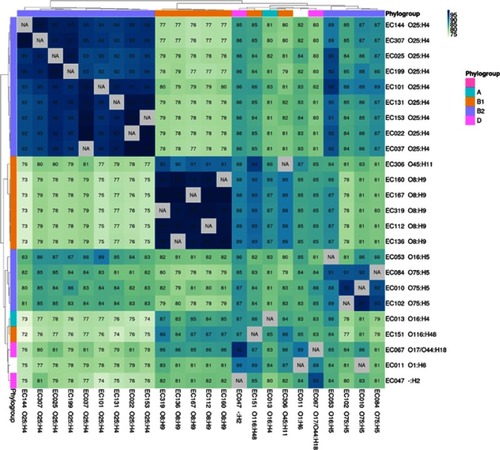
Table 3 Distribution of antibiotic resistance genes
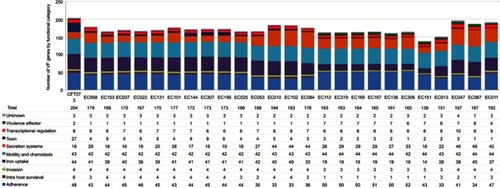
Figure 4 Number of virulence factor genes per functional category for the 24 assembled UPEC genomes. The strains are ordered by the phylogroup-ST. Each functional category is color coded.