
Figures & data
Table 1 Composition of cement groups tested in this study
Table 2 Accumulated antibiotics elution (Mean ± SD) for each group and the release ratios (%) after 28 days
Figure 1 The elution profiles (mean ± SD) of gentamicin (A) and vancomycin (B) over a 28-day period.
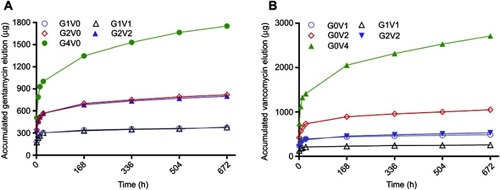
Figure 2 Compressive strength (A) and compressive modulus (B) of tested cement. The dashed line on the left represents the lower limit of 70 MPa established by ISO 5833.
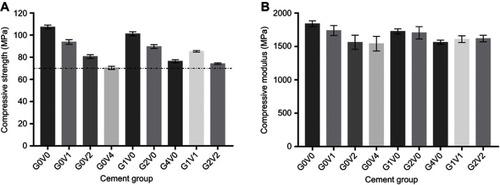
Table 3 The porosity (%) of each group after submerged in saline at 37°C for 28 days
Figure 3 The accumulated gentamicin (circle) and vancomycin (square) released from cement tested as a function of porosity. The dashed cycles represent the four pairs of data generated from G1V1 and G2V2. The solid and dashed lines show the trend between porosity and accumulated antibiotic elution.
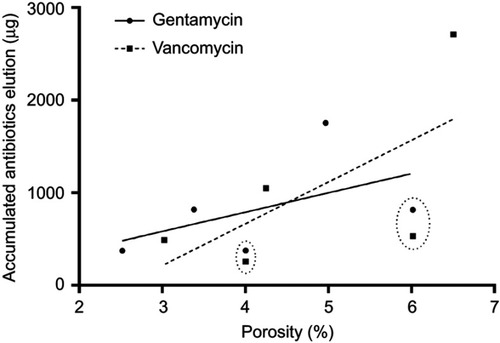
Figure 4 Antimicrobial activity of cement tested in this study. The pie chart represents these three bacteria that were the most commonly found in periprosthetic joint infection. Different colors represent different levels of bacterial growth as illustrated in the figure.
Abbreviations: S. aureus: Staphylococcus aureus ATCC 43300; E. feacalis: Enterococcus faecalis ATCC 29212; E. coli: Escherichia coli ATCC 35218.
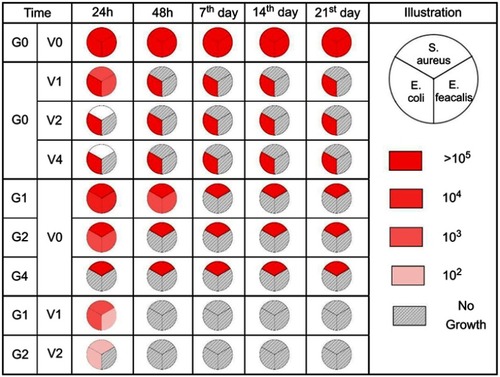
Table 4 The cell relative growth rate ([RGR] %) of L929 cell at different time periods detected with CCK8 procedure and the cytotoxicity scale (CTS) evaluated according to ISO10993.