Figures & data
Figure 1 Time-kill curves for AamAP1-Lysine-antibiotic combinations against (A) S. aureus ATCC 29213, (B) S. aureus ATCC 33591 and (C) P. aeruginosa ATCC BAA2114. Data represent the average of three different experiments.
Abbreviations: ATCC, American Type Culture Collection; MIC, Minimum Inhibitory Concentration; CFU, Colony Forming Unit.
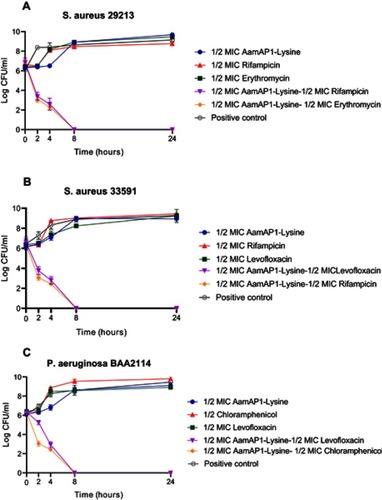
Table 1 Minimum inhibitory concentrations (MICs) of AamAP1-Lysine and the antibiotics individually against the tested bacterial strains. Results represent triplicates
Table 2 Minimum inhibitory concentrations (MICs) of AamAP1-Lysine and the antibiotics in combination against Gram-positive and Gram-negative bacteria. Results represent triplicates
Table 3 The fractional inhibitory concentration (FIC) indices of the antimicrobial combinations.
Table 4 The MBEC values and the FIC index of the successful synergistic combinations of AamAP1-Lysine combined with antibiotics
Figure S1 High-performance liquid chromatography analysis of AamAP1-Lysine
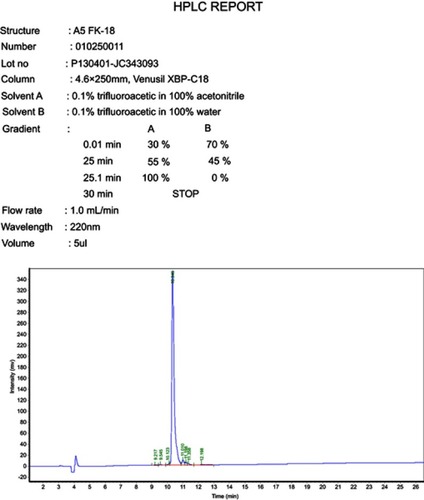
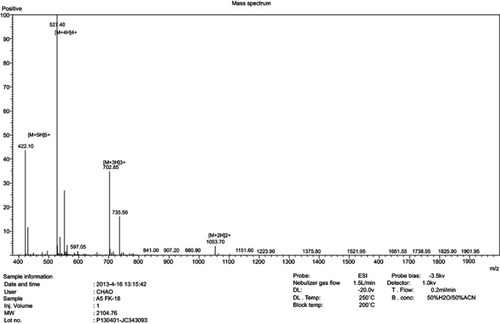
Figure S2 ESI-MS analysis of AamAP1-Lysine identifying displaying major peaks in the +2, +3, +4 and +5 charge state of 1053.70, 702.85, 527.40 and 422 Da, respectively