
Figures & data
Table 1 Patient characteristics
Figure 1 End of therapy SVR rates according to different treatments.
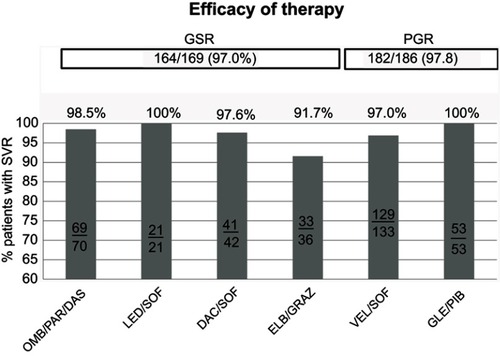
Figure 2 Kaplan–Meier curves of cumulative undetectable HCV RNA levels in patients according to GSR vs PGR (A) or in patients grouped as having GSR (B) or PGR (C). p-values were obtained using the log-rank test.
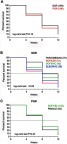
Figure 3 Kaplan–Meier curves of cumulative HCV RNA undetectable levels according to genotype and patients grouped as having GSR (A), PGR (B). Kaplan–Meier curves of cumulative HCV RNA undetectable levels according to genotype (C-G). p-values were obtained using the log-rank test.
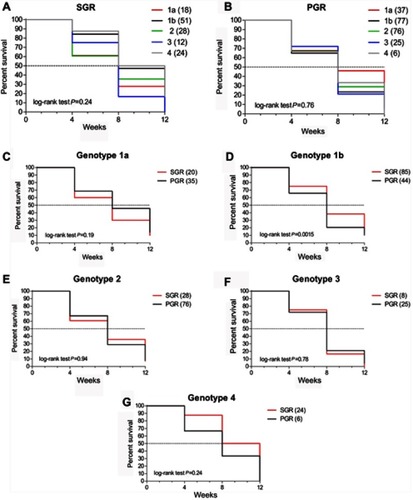
Table 2 DAA baseline RASs in HCV genes
Table 3 DAA RASs in patients with virologic failure