Figures & data
Table 1 Primers and cycling conditions used for the amplification of carbapenemase genes and the repetitive intergenic consensus
Table 2 Susceptibility pattern of A. baumannii clinical isolates
Table 3 Resistance patterns of the A. baumannii clinical isolates
Table 4 Relationship between genotypic profiles of carbapenemases and phenotypic resistance profiles A. baumannii for β-lactam antibiotics
Figure 1 DNA fingerprint pattern generated by ERIC-PCR for Acinetobacter clinical isolates. L, 100bp DNA ladder; lanes 1, 2, 3, 27,19, 26 and 32 represent the code No. of the isolates.
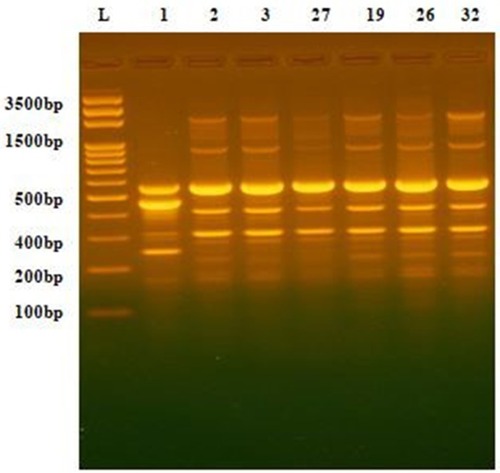
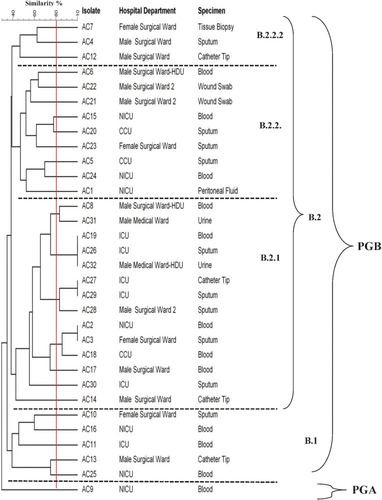
Figure 2 Clonal relationship between A. baumannii clinical isolates generated by UPGMA dendrogram.