
Figures & data
Figure 1 Structure diagram of three-layer BPNN. BPNNs start as a network of nodes in three layers: the input, hidden and output layers. The input and output layers serve as nodes to buffer input and output for the model, respectively, and the hidden layer serves to provide a means for input relations to be represented in the output.
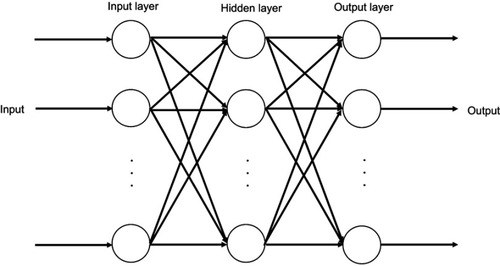
Table 1 Predicted monthly notification rate of pulmonary tuberculosis in 2016 using the ARIMA and BPNN model
Figure 2 Monthly notification rate of pulmonary tuberculosis from January 2005 to December 2015 in Jiangsu, China.
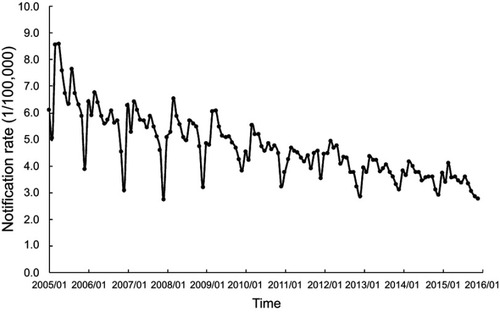
Figure 3 ACF and PACF plots. The autocorrelation function (ACF) and partial autocorrelation function (PACF) plots of pulmonary tuberculosis notification series after one nonseasonal and one seasonal difference (A). The ACF and PACF plots of residuals of the ARIMA (0,1,2) (0,1,1)12 model (B).
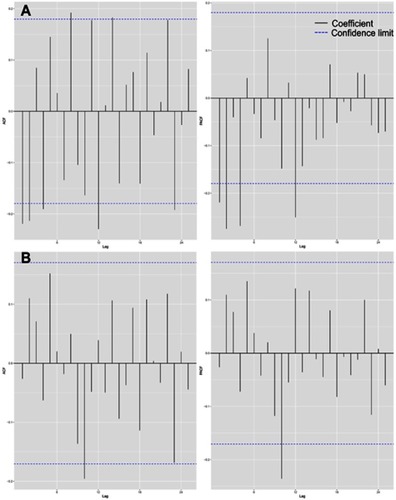
Table 2 Comparison of the fitting and forecasting performance of the two models
Figure 4 Fitting and forecasting curves of the ARIMA and BPNN models compared with the actual notification rate of pulmonary tuberculosis.
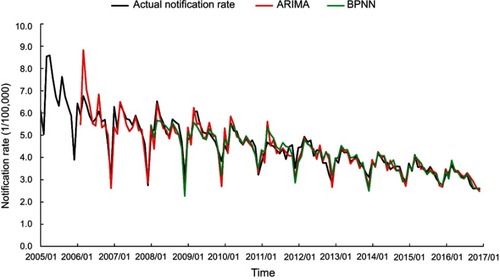
Table S1 AICc and BIC values of plausible ARIMA models
Table S2 Estimation of parameters of the ARIMA (0,1,2) (0,1,1)12 model
Table S3 MSE value of the testing set for each BPNN model
Table S4 Results of the ARIMA model and BPNN model in predicting the notification rate of pulmonary tuberculosis in 2016 stratified by gender and age (1/100,000)
Table S5 Comparison of the ARIMA model and the BPNN model in predicting the notification rate of pulmonary tuberculosis stratified by gender and age