
Figures & data
Table 1 Bacterial susceptibility to antimicrobials administered either alone or in combination with colistin at ½ its MIC
Figure 1 Average acridine orange (AO) accumulation in the presence of the efflux inhibitor PaβN and sub-inhibitory concentrations of colistin. (A–C) colistin-sensitive strains; (D) a species intrinsically resistant to colistin.
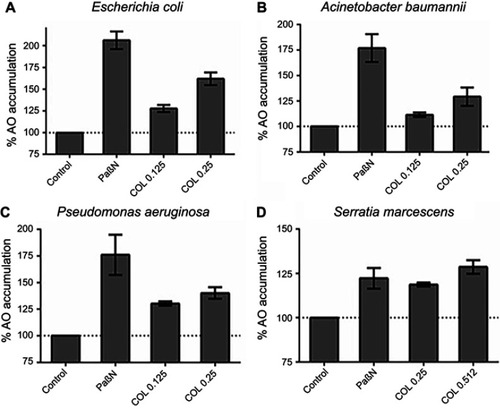
Figure 2 Confocal light microscopy imaging after Live/Dead staining of Pseudomonas aeruginosa. (A) Untreated cells; (B) cells treated with colistin at 0.25 μg/mL and (C) cells treated with colistin at bactericidal concentration. Similar images were obtained for Acinetobacter baumanii and E. coli (not shown). TEM of thin sections of S. marcescens after treatment with colistin. Blebs formed by the outer membrane are easily visualized.
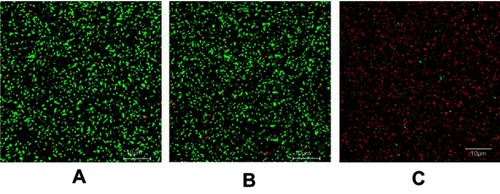
Table 2 Changes in membrane fluidity (anisotropy) in the presence of colistin