
Figures & data
Table 1 PCR primers and conditions used in this study
Table 2 Distribution of MICs of 11 antibiotics for 275 MDR Escherichia coli isolates
Table 3 Prevalence of mcr-1 & or ESBL-producing E. coli in swine samples collected from different farms of Jiangsu China
Table 4 The resistance patterns of E. coli with or without mcr-1
Table 5 Distribution of various resistance genes among 275 MDR Escherichia coli isolates from pigs
Figure 1 Distribution of various resistance genes in combination.
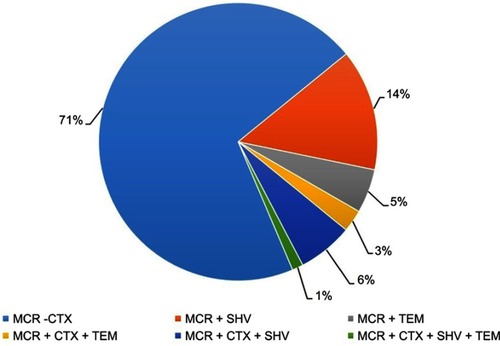
Table 6 Conjugation experiments and plasmid replicon type detection for 15 mcr-1-positive E. coli
Figure 2 Detection of plasmid replicon types in multidrug-resistant E. coli using PCR assay.
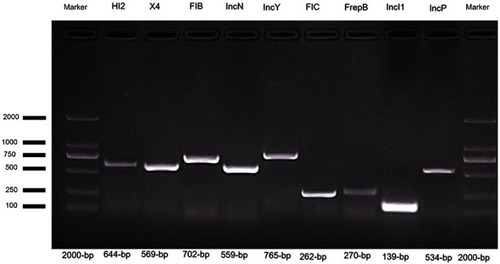
Figure 3 (A) S1-nuclease pulsed-field gel electrophoresis profiles of six E. coli and (B) Southern Blot hybridization of six E. coli carrying the mcr-1 plasmid.
Notes: M – Salmonella H9812 (15.0–242.5 kb); 1: E-55; 2: E-01; 3: E-09; 4: E-02; 5: E-44; and 6: E-37. The arrows in the figure represent the position of the mcr-1 plasmid.
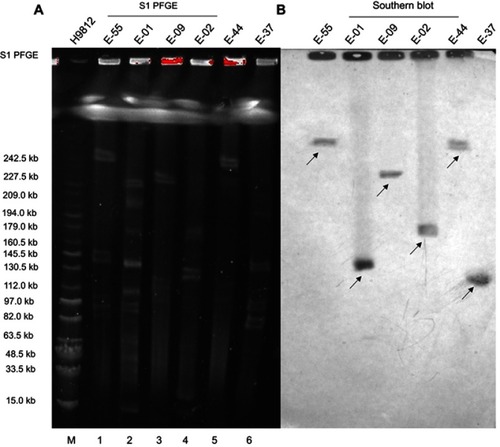
Figure S1 Map of sampling sites in Jiangsu province

Figure S2 Screening of mcr-1 and ESBL encoding genes in E. coli.
Notes: PCR product was separated on 1% agarose gel. Lane 1 and 6 shows 2000 bp molecular marker (Vazyme, Beijing, China); Lane 2, (mcr-1), Lane 3 (blaCTX-M) isolate; Lane 4, (blaTEM); and Lane 5 shows (blaSHV).
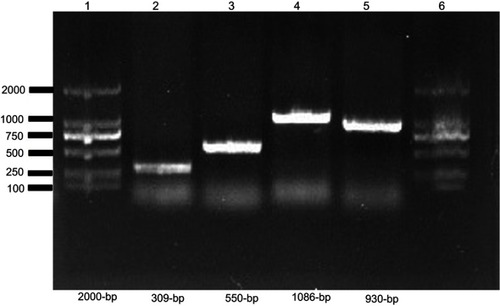
Table S1 List of primers used for plasmid replicons typing in this study