Figures & data
Figure 1 DENV infection alone or enhanced with 4G2 antibody was inhibited by polyphenols. (A) Molecular structure of polyphenolic compounds tested in this study. (B and D) Macrophages were infected with DENV-2 (B) or DENV-3 (D) at a MOI of 1, alone or in the presence of 4G2 antibody (dilutions 1:1024 for DENV-2 and 1:256 for DENV-3 are shown). After 1 hr of infection, cells were treated with noncytotoxic concentrations of polyphenols: 20 µM curcumin, 100 µM quercetin, 100 µM resveratrol, 40 µM apigenin, 100 µM rutin or 40 µM fisetin. Cell supernatants were collected at 72 hrs postinfection and viral titers (PFU/mL) were determined by plaque assay in BHK-21 cells. Untreated infected cells were included as controls. Bars represent average ± SD of three independent experiments done by duplicate. Data were analyzed by one-way ANOVA with subsequent Bonferroni´s test using GraphPad Prism 5.0. Asterisks represent statistical significance (*p<0.05, **p<0.01, ***p<0.001) compared with the respective controls. (C) Doseantiviral response of fisetin and quercetin in macrophages infected with DENV-2. U937-DC-SIGN cells were infected with DENV-2 and then treated with different concentrations of fisetin (2.5–40 µM) or quercetin (2.5–100 µM). Supernatants were collected at 72 hpi and viral titers were determined by plaque assay as mentioned. The percentage of infection was calculated by comparing treated versus untreated cells, the inhibitory concentration (IC50) was calculated using GraphPad Prism 5.0. In both cases, data represent the average ± SD of three independent experiments.
Abbreviations: DENV, dengue virus; MOI, multiplicity of infection; PFU, plague-forming unit.
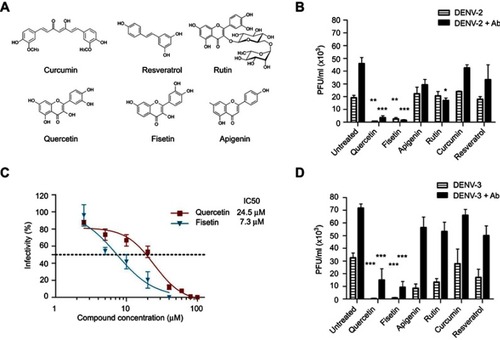
Table 1 Cytokine production in U937-DC-SIGN cells at the time of maximal secretion
Figure 2 Cytokine production in monocytes and macrophages. Kinetics of cytokine production was determined in U937-DC-SIGN monocytes and macrophages either uninfected or infected with DENV-2 at a MOI=1. Cell supernatant was collected at different times (6, 12, 24, 48, 72 and 96 hrs) and the concentration of IL-6 (A), TNF-α (B), IL-10 (C) and IFN-γ (D) was determined by ELISA. Data were analyzed by two-way ANOVA with subsequent Bonferroni´s test using GraphPad Prism 5.0. Nonlinear regression analysis was performed to obtain trend lines. Asterisks represent statistical significance (*p<0.05; ***p<0.001) between uninfected and DENV-2-infected macrophages.
Abbreviations: DENV, dengue virus; MOI, multiplicity of infection.
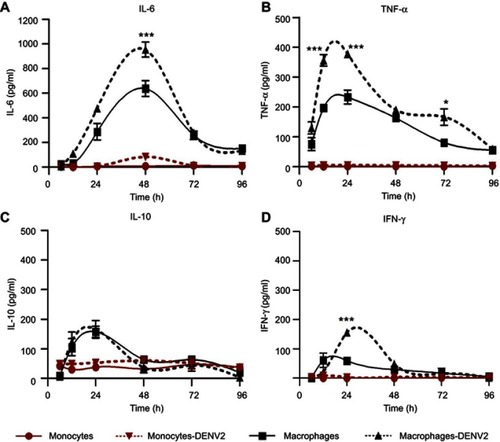
Figure 3 Cytokine secretion in U937-DC-SIGN cells infected with DENV-2. Kinetics of cytokine secretion was analyzed in macrophages. Controls correspond to PMA differentiated but not infected cells. DENV-2 represents infection without antibody. DENV-2 ADE indicates infection done in the presence of 4G2 antibody at 1:1024 dilution. Cell supernatants were collected at 6, 12, 24, 48, 72 and 96 hpi and the concentrations of IL-6 (A), TNF-α (B), IL-10 (C) and IFN-γ (D) were determined by ELISA. Data were analyzed by two-way ANOVA with subsequent Bonferroni´s test using GraphPad Prism 5.0. Asterisks represent statistical significance (**p<0.01; ***p<0.001) between DENV-2 and DENV-2-ADE.
Abbreviation: DENV, dengue virus.
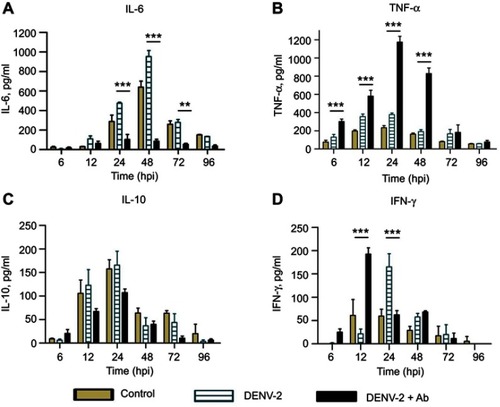
Figure 4 Cytokine secretion in U937-DC-SIGN cells infected with DENV-3. Kinetics of cytokine secretion was analyzed in macrophages. Controls correspond to PMA differentiated but not infected cells. DENV-3 represents infection without antibody. DENV-3 ADE indicates infection done in the presence of 4G2 antibody at 1:256 dilution. Cell supernatants were collected at 6, 12, 24, 48, 72 and 96 hpi and the concentrations of IL-6 (A), TNF-α (B), IL-10 (C) and IFN-γ (D) were determined by ELISA. Data were analyzed by two-way ANOVA with subsequent Bonferroni´s test using GraphPad Prism 5.0. Asterisks represent statistical significance (***p<0.001) between DENV-3 and DENV-3-ADE.
Abbreviation: DENV, dengue virus.
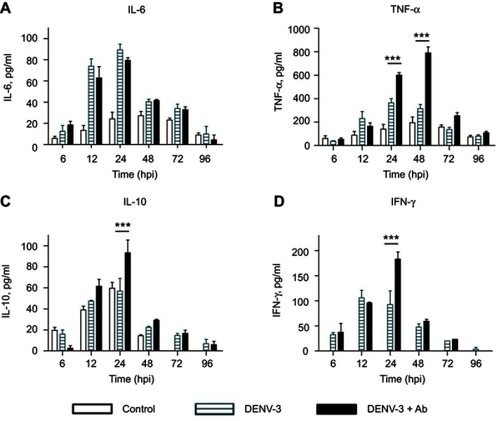
Figure 5 Effect of quercetin and fisetin on macrophages infected with DENV-2. Macrophages were infected with DENV-2 at a MOI of 1 (A–C) or with mixtures of DENV-2 and 4G2 antibody (ADE) at 1:1024 dilution (D–F). Viral inoculum was discarded after 1 hr of infection and fresh medium was added with 100 µM of quercetin or 40 µM of fisetin. Untreated infected macrophages were included for comparison (A and D). Cell supernatants were collected at different times postinfection and the concentrations of IL-6, TNF-α, IL-10 and IFN-γ were determined by ELISA. Data represent average ± SD of two independent and duplicated experiments; nonlinear regression analysis was performed using GraphPad Prism 5.0 to obtain trend lines.
Abbreviations: DENV, dengue virus; MOI, multiplicity of infection.
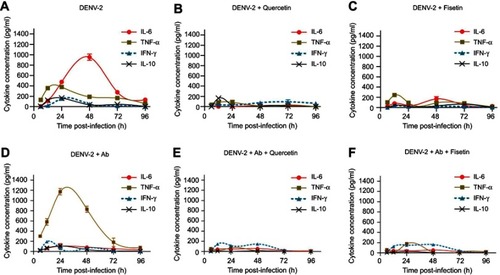
Figure 6 Effect of quercetin and fisetin on macrophages infected with DENV-3. Macrophages were infected with DENV-3 at a MOI of 1 (A–C) or with mixtures of DENV-3 and 4G2 antibody (ADE) at 1:256 dilution (D–F). Viral inoculum was discarded after 1 hr of infection and fresh medium was added with 100 µM of quercetin or 40 µM of fisetin. Untreated infected macrophages were included for comparison (A and D). Cell supernatants were collected at different times postinfection and the concentrations of IL-6, TNF-α, IL-10 and IFN-γ were determined by ELISA. Data represent average ± SD of two independent and duplicated experiments; nonlinear regression analysis was performed using GraphPad Prism 5.0 to obtain trend lines.
Abbreviations: DENV, dengue virus; MOI, multiplicity of infection.
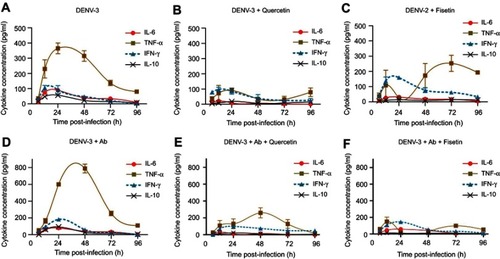
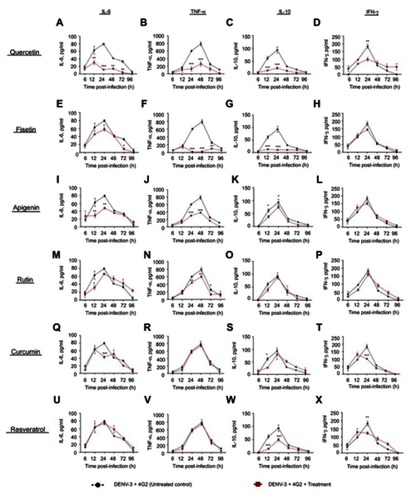
Figure S1 Cytokine secretion in DENV-2 infected macrophages treated with polyphenols. Kinetics of cytokine production was determined in U937-DC-SIGN macrophages infected with DENV-2 at a MOI=1. Cells were untreated or treated at 1 hr after infection with 100 µM quercetin (A–D), 40 µM fisetin (E–H), 40 µM apigenin (I–L), 100 µM rutin (M–P), 20 µM curcumin (Q–T) or 100 µM resveratrol (U–X). Cell supernatants were collected at different times after infection (6, 12, 24, 48, 72 and 96 hrs) and the concentrations of IL-6, TNF-α, IL-10 and IFN-γ were determined by ELISA. Data represent average ± SD of two independent and duplicated experiments; data were analyzed by two-way Anova with subsequent Bonferroni´s test using GraphPad Prism 5.0. Asterisks represent statistical significance (*p<0.05; **p<0.01; ***p<0.001) between untreated and treated macrophages. Abbreviations: DENV, dengue virus; MOI, multiplicity of infection.
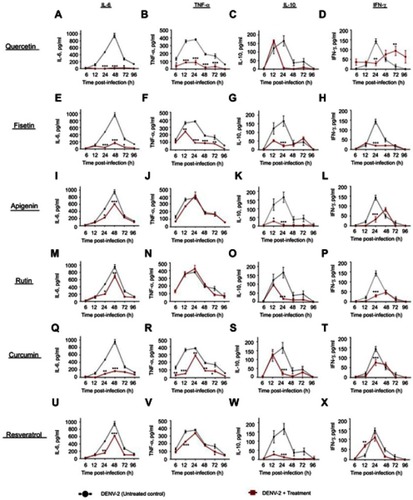
Figure S2 Effect of polyphenols on cytokine secretion in macrophages infected with DENV-2-4G2 antibody complexes. Macrophages were infected with mixtures of DENV-2 at a MOI of 1 and 4G2 antibody at 1:1024 dilution. Cells were untreated or treated at 1 hr after infection with 100 µM quercetin (A–D), 40 µM fisetin (E–H), 40 µM apigenin (I–L), 100 µM rutin (M–P), 20 µM curcumin (Q–T) or 100 µM resveratrol (U–X). Cell supernatants were collected at different times after infection (6, 12, 24, 48, 72 and 96 hrs) and the concentrations of IL-6, TNF-α, IL-10 and IFN-γ were determined by ELISA. Data represent average ± SD of two independent and duplicated experiments; data were analyzed by two-way Anova with subsequent Bonferroni´s test using GraphPad Prism 5.0. Asterisks represent statistical significance (*p<0.05; **p<0.01; ***p<0.001) between untreated and treated macrophages.
Abbreviations: DENV, dengue virus; MOI, multiplicity of infection.
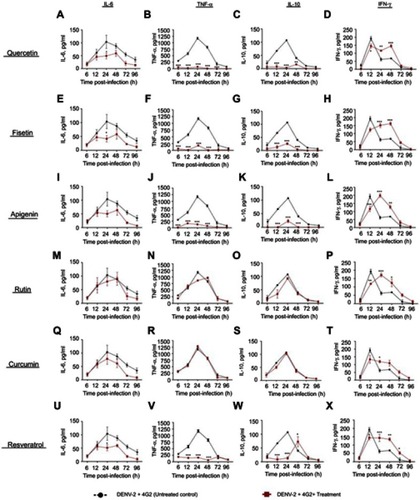
Figure S3 Cytokine secretion in DENV-3 infected macrophages treated with polyphenols. Kinetics of cytokine production was determined in U937-DC-SIGN macrophages infected with DENV-3 at a MOI=1. Cells were untreated or treated at 1 hr after infection with 100 µM quercetin (A–D), 40 µM fisetin (E–H), 40 µM apigenin (I–L), 100 µM rutin (M–P), 20 µM curcumin (Q–T) or 100 µM resveratrol (U–X). Cell supernatants were collected at different times after infection (6, 12, 24, 48, 72 and 96 hrs) and the concentrations of IL-6, TNF-α, IL-10 and IFN-γ were determined by ELISA. Data represent average ± SD of two independent and duplicated experiments; data were analyzed by two-way Anova with subsequent Bonferroni´s test using GraphPad Prism 5.0. Asterisks represent statistical significance (*p<0.05; **p<0.01; ***p<0.001) between untreated and treated macrophages.
Abbreviations: DENV, dengue virus; MOI, multiplicity of infection.
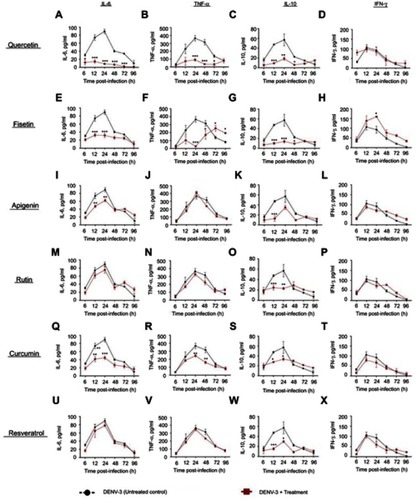
Figure S4 Effect of polyphenols on cytokine secretion in macrophages infected with DENV-2-4G2 antibody complexes. Macrophages were infected with mixtures of DENV-3 at a MOI of 1 and 4G2 antibody at 1:256 dilution. Cells were untreated or treated at 1 hr after infection with 100 µM quercetin (A–D), 40 µM fisetin (E–H), 40 µM apigenin (I–L), 100 µM rutin (M–P), 20 µM curcumin (Q–T) or 100 µM resveratrol (U–X). Cell supernatants were collected at different times after infection (6, 12, 24, 48, 72 and 96 hrs) and the concentrations of IL-6, TNF-α, IL-10 and IFN-γ were determined by ELISA. Data represent average ± SD of two independent and duplicated experiments; data were analyzed by two-way Anova with subsequent Bonferroni´s test using GraphPad Prism 5.0. Asterisks represent statistical significance (*p<0.05; **p<0.01; ***p<0.001) between untreated and treated macrophages.
Abbreviations: DENV, dengue virus; MOI, multiplicity of infection.