
Figures & data
Table 1 Characteristics of workers (N=275)
Table 2 Prevalence of antibiotic resistance among the 95 Staphylococcus aureus isolates
Figure 1 Distribution of antibiotic resistance patterns of the 3 MRSA strains.
Notes: *Blackened cells indicate non-susceptibility and grey cells indicate susceptibility to the antibiotic. All MRSA isolates were susceptible to CIP, CLI, GEN, LNZ, SXT, RIF.
Abbreviations: CIP, ciprofloxacin; CLI, clindamycin; ERY, erythromycin; GEN, gentamicin; LNZ, linezolid; MUP, mupirocin; SXT, trimethoprim-sulfamethoxazole; QDA, quinupristin-dalfopristin; RIF, rifampicin; TET, tetracycline; CEF, cefoxitin; OX, oxacillin.
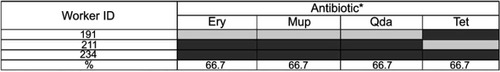
Table 3 Cross-resistance of Staphylococcus aureus isolates
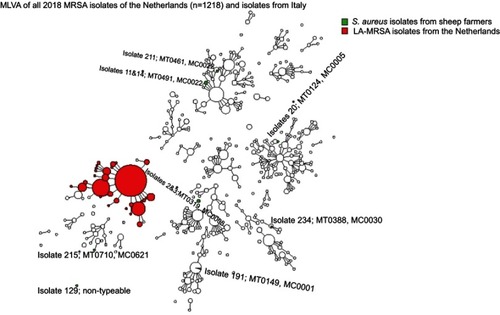
Figure 2 Minimum spanning tree of the Staphylococcus aureus isolates typed by Multiple-locus variable number of tandem repeat analysis (MLVA).
Notes: *These isolates were methicillin-sensitive S. aureus (MSSA).
Abbreviations: LA, livestock associated; MT, MLVA type; MC, MLVA complex.
Data availability
The datasets used and/or analyzed during the current study are available from the corresponding author on reasonable request.